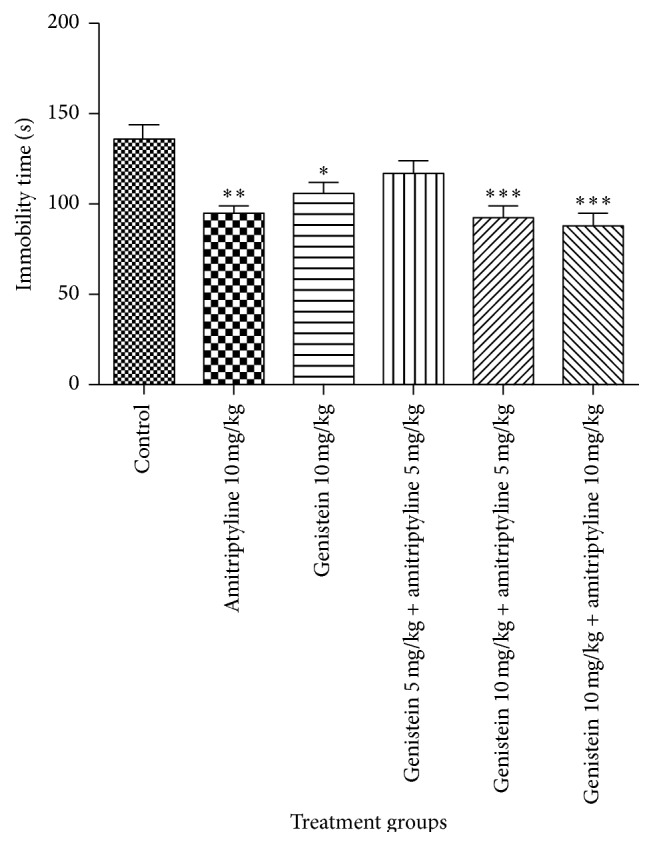
Figure 3.

Effects of the standard drugs and their combined treatments on immobility time on 10th day. Values represent the mean ± SEM (n = 6). ∗∗∗ p < 0.001, ∗∗ p < 0.01, and ∗ p < 0.05 were considered significant as compared to control group. Data were analyzed with one-way ANOVA followed by Dunnett's post hoc test.
