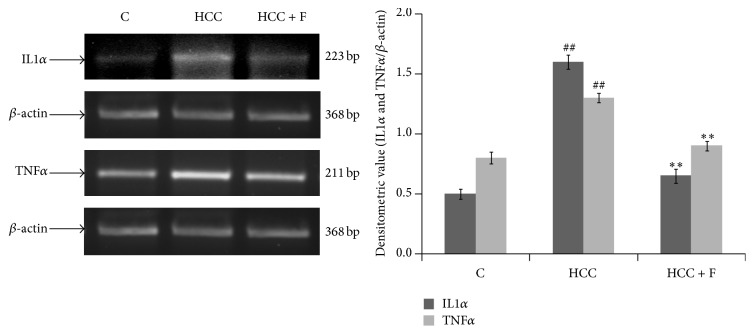
Figure 5.
Effect of Fisetin on the level of proinflammatory cytokines, TNFα and IL1α, in the liver from control (C), HCC, and Fisetin treated HCC rats. The figure shows representative RT-PCR photographs from four repeats with the normalized densitometric values of TNFα/β-actin and IL1α/β-actin as mean ± SD from four RT-PCR repeats. ## p < 0.01 (control versus HCC group) and ∗∗ p < 0.01 (HCC versus HCC + F group).

