
Figure 3.
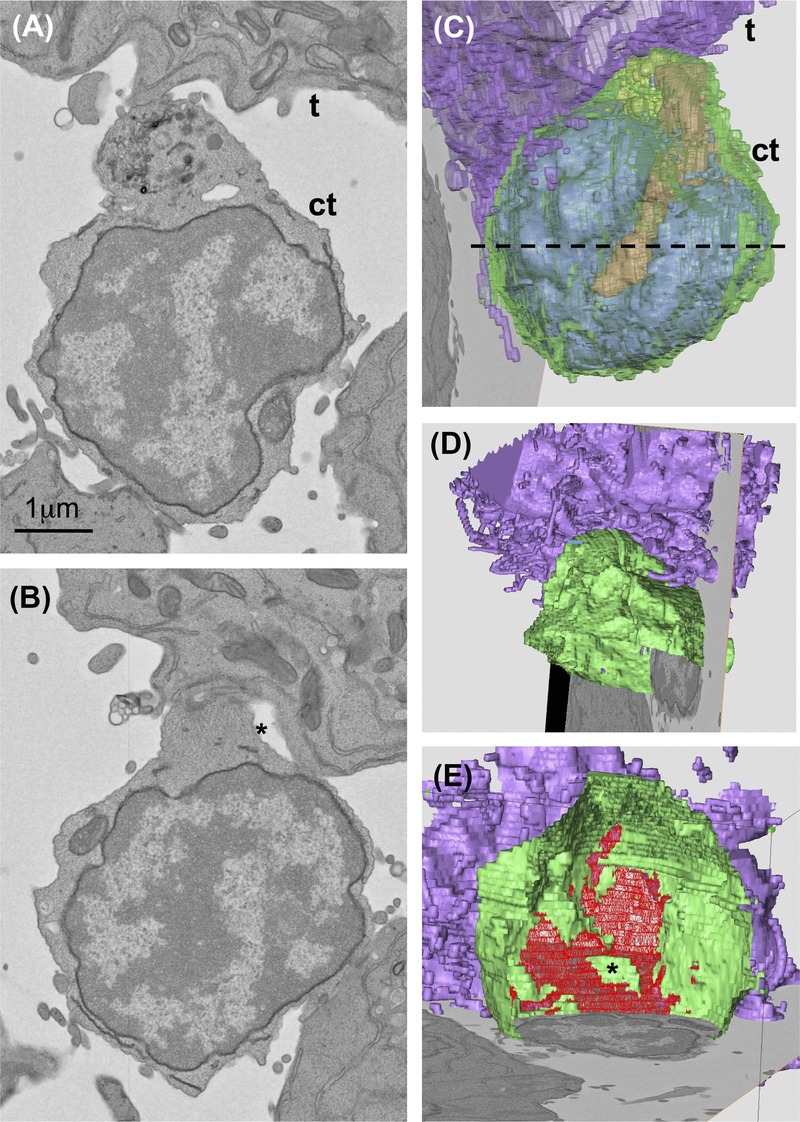
Reconstruction of an immunological synapse: cell population isolated from WKM and cultured with HL60 cell line, cell couple identified on low magnification images of whole sections produced with Atlas 5 Array Tomography platform. Sections 30 (A), 23 (B) from a set of 52 sections (nominal thickness 100nm), t = target cell, ct = cytotoxic cell. 3D representation of volume segmented in Amira (C, D, E) to illustrate relocation of secretory organelles towards target cell (C) and the contact zone (star indicates luminal space) between the two cells (D, E). Dashed line in C shows where cytotoxic cell was cut open virtually for (D) and (E). Colour codes: plasma membrane green, nucleus and endoplasmic reticulum blue, mitochondria red, Golgi complex/ lysosomes yellow/orange, target cell membrane purple, contact zone between both cells patterned in red (E).