
Figure EV3. Protein–peptide binding affinity assays.
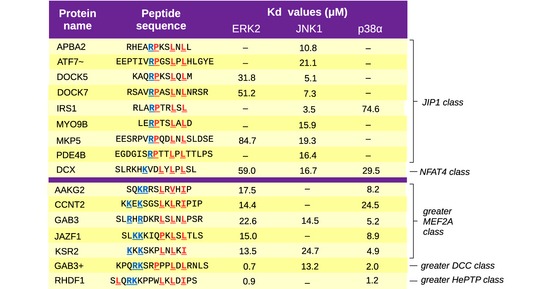
The results of fluorescence polarization (FP) titrations are displayed in a tabulated format, showing the sequence of synthetic peptide used together with the dissociation constants (Kd) obtained for each MAPK (see also Appendix Fig S3). Dashes indicate cases where the curves could not be fitted (the Kd is above the limit of quantitation of this assay, approximately ~100 μM). Peptides are grouped in two clusters, the first being the strong JNK1 binders (frequently with little or no ERK2/p38α‐binding ability). The second group (below the magenta line) contains peptides with strong ERK2‐ and p38α‐binding capacity (but often little or no affinity toward JNK1). Coloring of the peptide residues displays the critical charged θ residues in blue and the φ hydrophobic positions in red (according to the best fitting structural models). ~: The ATF7 peptide has non‐native flanking amino acids (several glutamic acids were added onto both its N‐ and C‐terminal ends) in order to make the peptide soluble near neutral pH. +: Motif not included in the dot‐blot screens. Gab3+ is the ortholog of a peptide from Gab1 which was tested as positive in the dot‐blot experiments. The two Gab3 motifs are related neither by structure nor by evolutionary origin.