
Figure 7. Evolutionary analysis of D‐motifs.
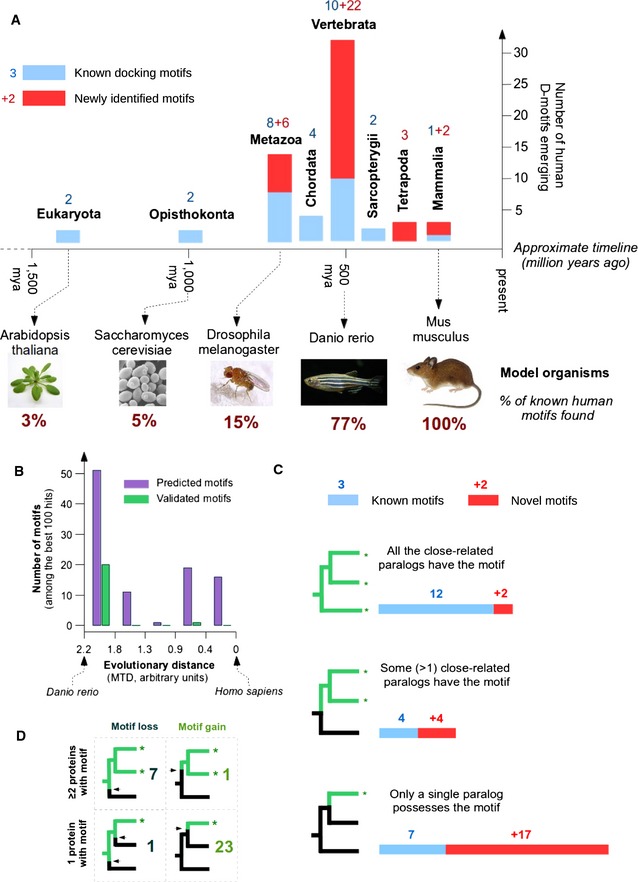
- Analysis of MAPK‐docking motif emergence (based on p‐BLAST searches) paints a dynamic picture of MAPK pathway evolution. The panel was made based on 62 independent MAPK D‐motif occurrences (see Table EV3). The histogram counts the number of known D‐motifs (blue bars and blue numbers) and those newly identified in our experiments (red bars and red numbers). An approximate timeline is also added to give a realistic scale of the time dimension. The percentage of mammalian motifs found in selected model organisms is also indicated. Among model organisms, mice and zebrafish are relatively similar to human based on their MAPK interactomes. But fruit flies or yeast are rather poor models due to the low number of docking motifs being conserved across species.
- Distribution of the 100 best JIP1‐type motifs (predicted by the PSSM) versus their eggNOG‐derived maximum traceable distance. Motifs validated experimentally as binders are represented under the green columns, while the total number of predicted motifs is shown in magenta. The analysis suggests that the most recently emerged motifs are still under‐explored. While a reasonable percentage of D‐motifs shared between humans and zebrafish were successfully validated in experiments, there also appears to be an intriguing number of (predicted) motifs restricted to mammals only. Note that this distance metric is different from the one used in (A) and extends to bony fishes only.
- The branching pattern of closely related human proteins with MAPK‐docking motifs points at rapid evolution. Most of the already‐established MAPK partner proteins (blue bars) are members of families where more than one paralog carries the same motif. However, the more recently identified docking motifs (red bars) show a rather different picture. Proteins with stand‐alone docking motifs thus appear to be much more common than previously expected.
- Comparison of vertebrate and invertebrate genomes suggests that most novel D‐motifs may provide paralog‐specific regulation. The panel traces the emergence of D‐motifs within protein families. Where multiple vertebrate paralogs carry the same motif, the docking elements are overwhelmingly pre‐vertebrate inventions (often subject to motif loss, upper rows). However, where only a single paralog has the motif, the trend is exactly the opposite: Most motifs have typically newly evolved and have no counterpart in invertebrates (lower rows).