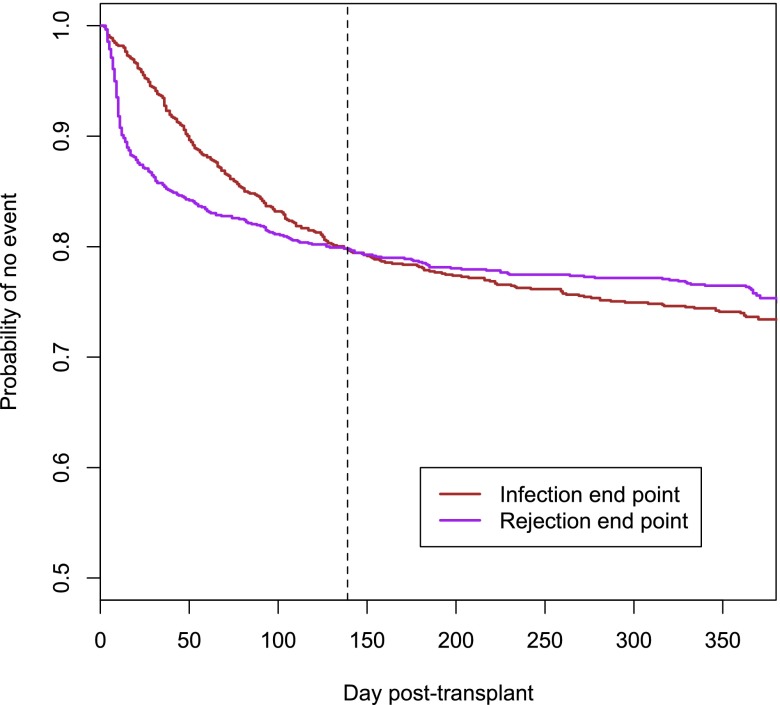
Figure 1.
Rejections and severe infections have similar incidences in the first year after transplantation. Kaplan–Meier estimate of freedom from the rejection end point and the infection end point. Kaplan–Meier curves in consideration of the complete study population of the Efficacy Limiting Toxicity Elimination Symphony Study (study arms A–C; n=1190). The curves for infection (red) and rejection (purple) end points intersect at day 139 after transplantation.

