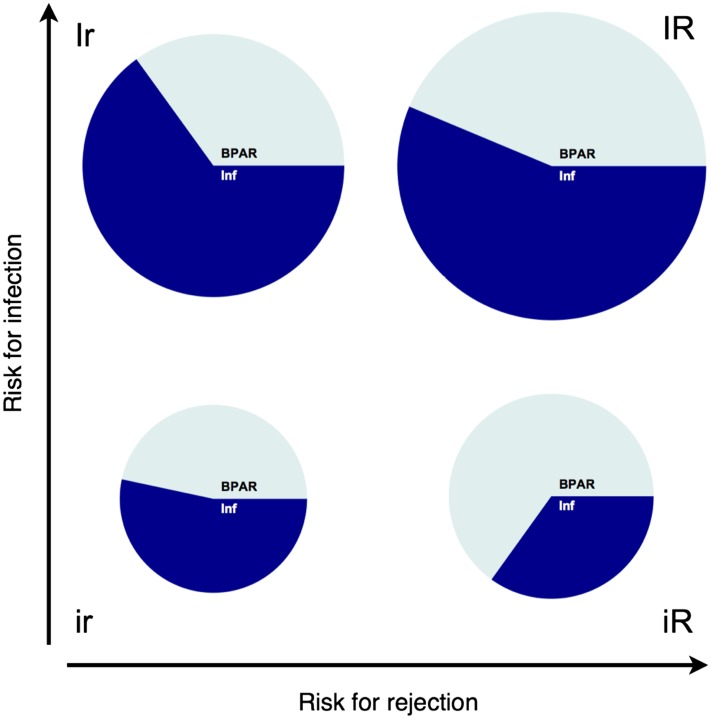
Figure 3.
The two-dimensional risk stratification model discriminated the subgroups in terms of composite end point, rejection and infection in the internal validation. Patients in the validation cohort were classified in four risk groups according to the two–dimensional stratification model. The registered incidences of infection and rejection end points in the four subgroups are shown. The area of the pie plot is proportional to the event frequency (proportion of patients with an event of any type in the respective quadrant). The compartments of the pie plots indicate the incidence of rejection and infection in patients with at least one episode. BPAR, biopsy–proven acute rejection; Inf, infection; ir, low risk for both infection and rejection; iR, low risk for infection and high risk for rejection; Ir, high risk for infection and low risk for rejection; IR, high risk for both infection and rejection.

