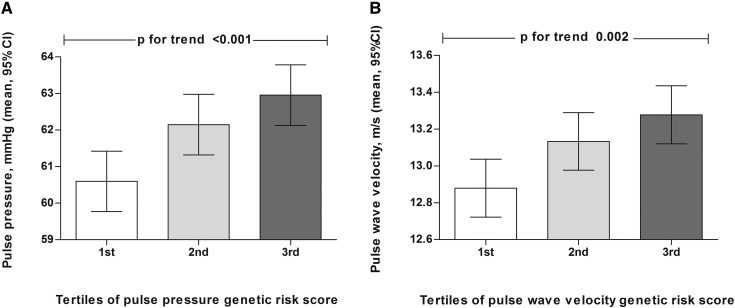
Figure 1.
Linear association between arterial stiffness measures and their corresponding genetic risk scores. (A) Mean and SEM of pulse pressure in tertiles of pulse pressure genetic risk score. (B) Mean and SEM of pulse wave velocity in tertiles of pulse wave velocity genetic risk score. Analyses are adjusted for age and sex. 95% CI, 95% confidence interval.

