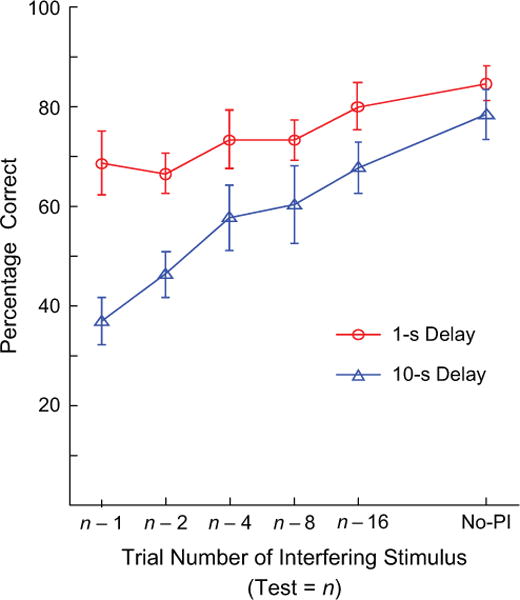
Fig. 2.

Mean results of 4 pigeons on the same/different task at 1-s and 10-s delays between the offset of the sample stimulus and onset of the test stimulus. Percentage correct is shown as a function of the number of trials separating the interfering stimulus and the test. On the left of the x-axis, “n − 1” refers to the condition in which the interfering stimulus occurred on the immediately preceding trial. On the right of the x-axis, “no-PI” refers to the no-interference, or different-trial baseline, condition. Error bars represent standard errors of the mean.
