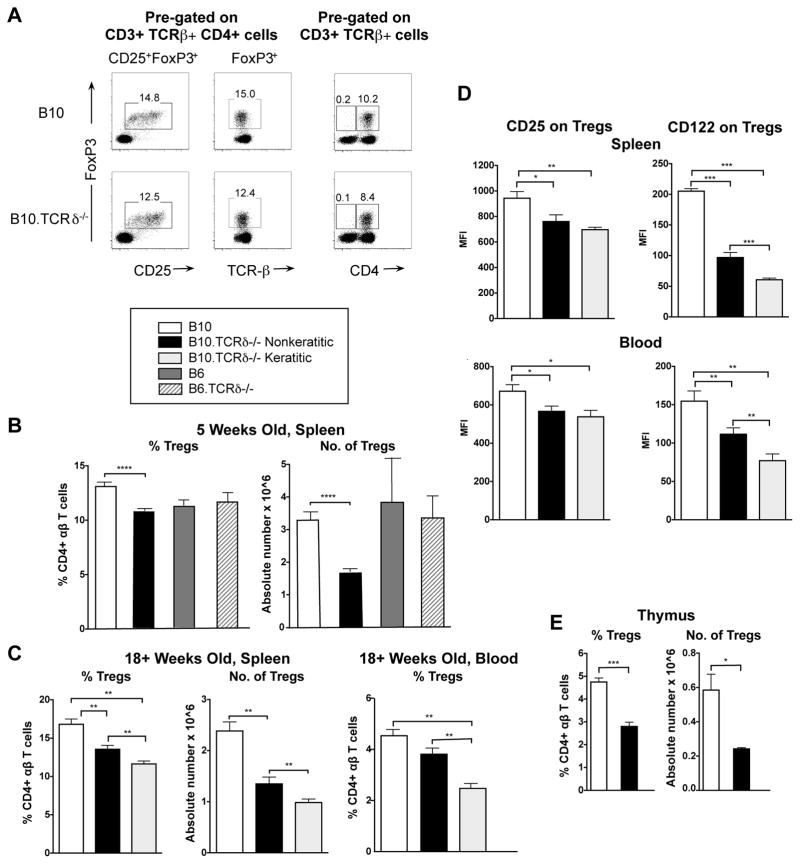
Fig. 5. Tregs are reduced in B10.TCRδ−/− mice.
Cells from the indicated tissues were analyzed by flow cytometry, after cell surface staining for CD3, TCR-β, CD4, and CD25, plus intracellular staining for FoxP3 expression. For B-E, columns represent samples from the mice indicated in the key above panel B, and shows the mean value obtained from multiple mice; errors bars indicate SEM. A. Representative flow cytometry plots from a B10 and a B10.TCRδ−/− mouse, both five weeks old. The two left-most panels illustrate that among CD4+ αβ T cells (CD3+ TCR-β+), virtually all FoxP3+ cells are also CD25+. The right panel shows that within αβ T cells (CD3+ TCR-β+), virtually all FoxP3+ cells are also CD4+. Thus, using a relatively generous gate for CD25, the FoxP3 regulatory cells present in these mice almost entirely are represented by CD4+ CD25+ Tregs. B. Results are from spleens of five week-old female mice (9 mice for B10, 12 for B10.TCRδ−/−, and 4 each B6 and B6.TCRδ−/−). C. Results are from spleens and blood of 18–30 week old females (6–10 mice per group). D. Mean fluorescence intensity (MFI) was determined for CD25 and CD122 by flow cytometry using mAb specific for these molecules, among CD4+ CD25+ FoxP3+ cells from spleen (top panels) or blood (bottom panels) of female mice of the indicated strains. E. Results are from thymi of 9 week-old female mice (4 mice per strain were analyzed).

