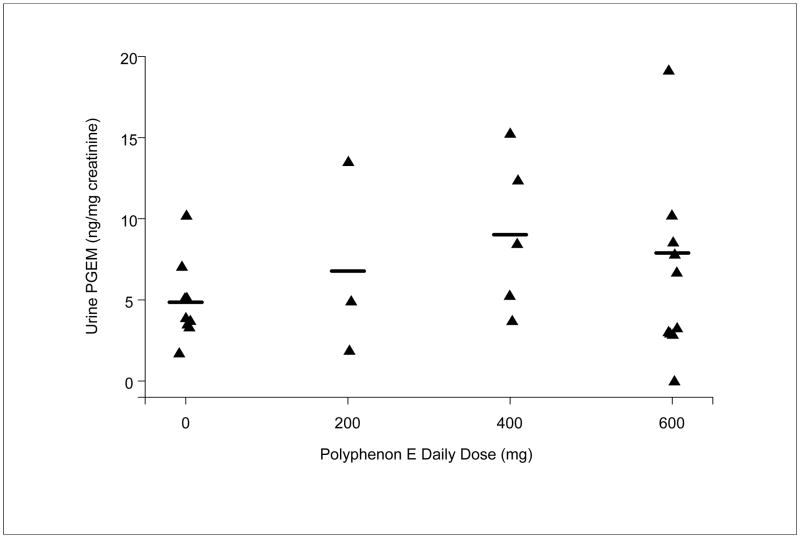
Figure 3. Mean PGE-M concentrations (ng/mg creatinine) in urine specimens.
Urine specimens were collected after 3–4 months of treatment with Placebo or Poly E (200 mg, 400 mg, 600 mg). PGE-M concentration was measured by liquid chromatography. PGE-M concentration was assayed and interpreted by an observer blinded to the treatment (placebo versus Poly E).

