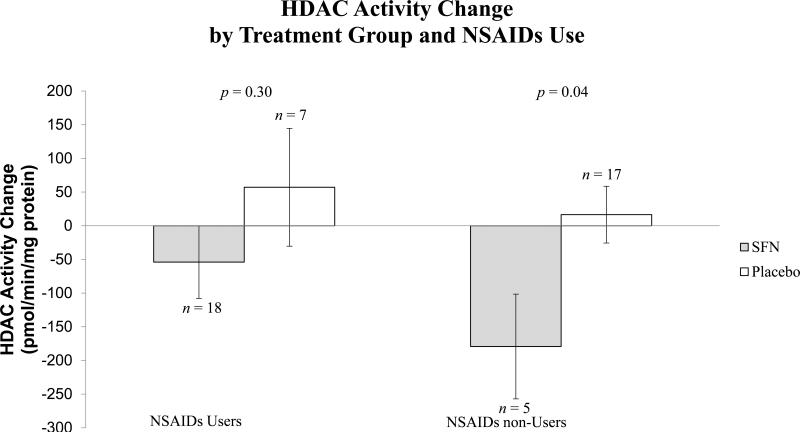
Figure 2. Comparison of PBMC HDAC activity change between intervention groups stratified by NSAIDs use.
Changes in HDAC activity from pre- to post-intervention between treatment groups were compared stratified by NSAIDs use using mixed effect model. Values shown indicate least-squares means of (lsmean ± SE) of pre-to-post change of HDAC activity.

