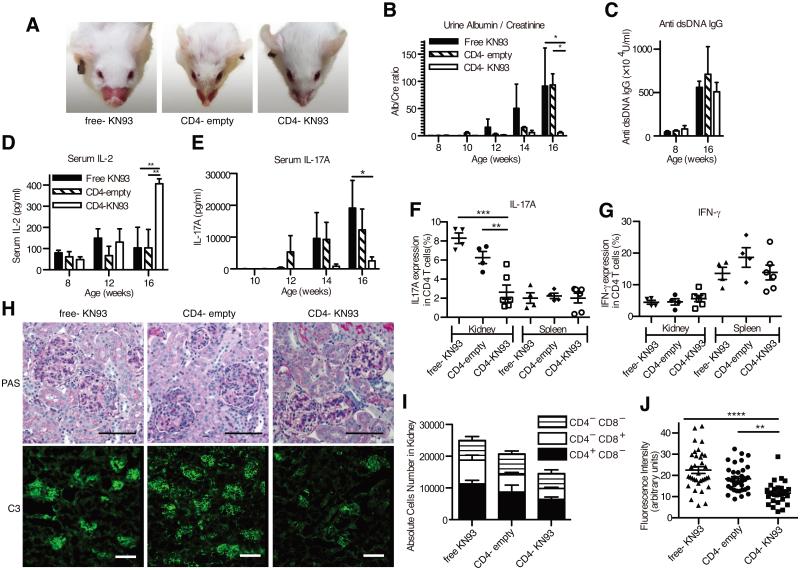
Figure 3.
Anti-CD4 antibody coated nlg- KN93 suppresses disease progressions in MRL/lpr mice. (A) The representative pictures of facial skin rush from mice (16 weeks of age) treated with free- KN-93 (10μg/week/mouse), anti CD4 antibody coated nlg- empty (CD4− nlg- empty) and CD4− nlg- KN-93 (10μg of KN93 /week/mouse). The treatment was started from 8 weeks of age to 16 weeks (i.p. injections; 8 times in total). (B) The mean ratio of urine albumin and creatinine from the mice of each treatment group. Urine samples were obtained biweekly and determined by albumin and creatinine ELISA. (C - E) The mean titer of anti- dsDNA antibody (C), IL-2 (D) or IL-17A (E) in serum in each group on indicated weeks determined by ELISA. (F and G) The frequencies of IL-17A- (F) and IFN-γ- (G) producing CD4+ T cells in kidneys or in spleen by Flow cytometry using intra cellular cytokine staining. (H) Representative images of glomerular areas from 16-week-old MRL/lpr mice with each treatment. PAS staining are shown in the upper panels and C3 deposition detected by immunofluorescence are in the lower. Each scale bar represents 100 μm. (I) The cumulative numbers of infiltrating T lymphocyte in the kidney from the indicated treatment group at 16 weeks of age. The numbers of each T lymphocyte are divided into 3 groups; CD4+CD8−, CD4−CD8+ and CD4−CD8− T cells. (H) The fluorescence intensity of C3 deposition measured in each glomeruli from the mice of the indicated treatment group. Representative data of 3 independent experiments are shown (n=4-6 mice per group) in B-E and I and each symbol represents an independent sample in F, G and J. Error bars represent the mean ± SEM. * P < 0.05, ** P < 0.01, *** P < 0.001, **** P < 0.0001 by 1way ANOVA (F and J) or 2way ANOVA(B, D, E and F) with Bonferroni’s post-test.

