
Figure 1.
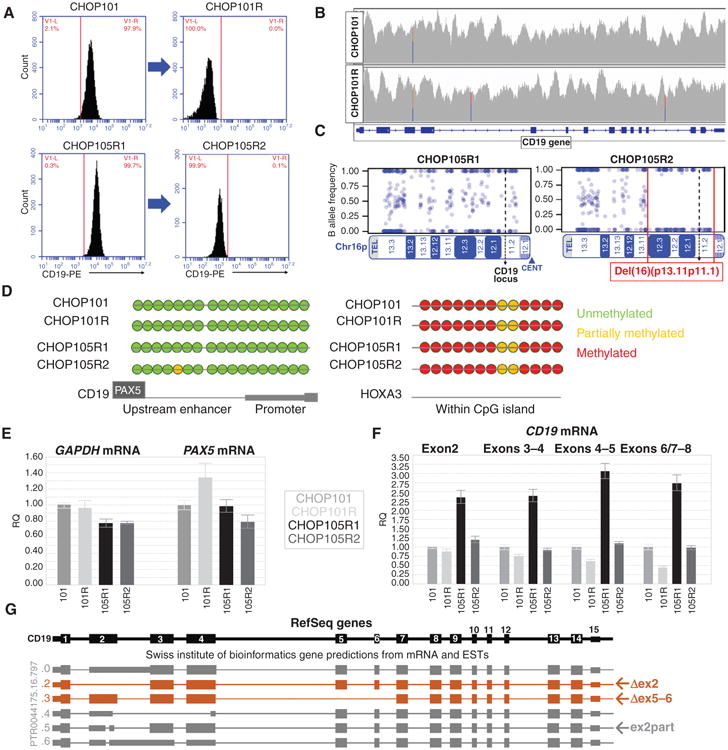
Retention of CD19 genetic material in relapsed leukemias. A, flow cytometric profiles of CD19 surface expression in paired B-ALL samples included in subsequent analyses. B, CD19 gene coverage obtained through whole-genome sequencing of CHOP101 and CHOP101R samples. C, SNP array analysis of Chr16p performed on DNA from 105R1 and 105R2 showing the large hemizygous deletion (red brackets) found in the CHOP105R2 sample. D, direct bisulfite sequencing of the enhancer and promoter regions of CD19 (downstream of the PAX5-binding site) in the paired samples. A CpG island within the HOXA3 locus was analyzed as a positive control. E, qRT-PCR analysis of PAX5 mRNA expression in xenografted patient samples. ACTB and GAPDH were used as reference genes. F, qRT-PCR analysis of different regions of the CD19 mature mRNA in all qPCR panels; graphs show relative quantifications of expression ± 1 SD. G, Genome browser SIB track predicted isoforms of CD19 mRNA, including those skipping exon 2 (Δex2) and exons 5 and 6 (Δex5–6), and the partial deletion of exon 2 (ex2part) that shifts the reading frame.