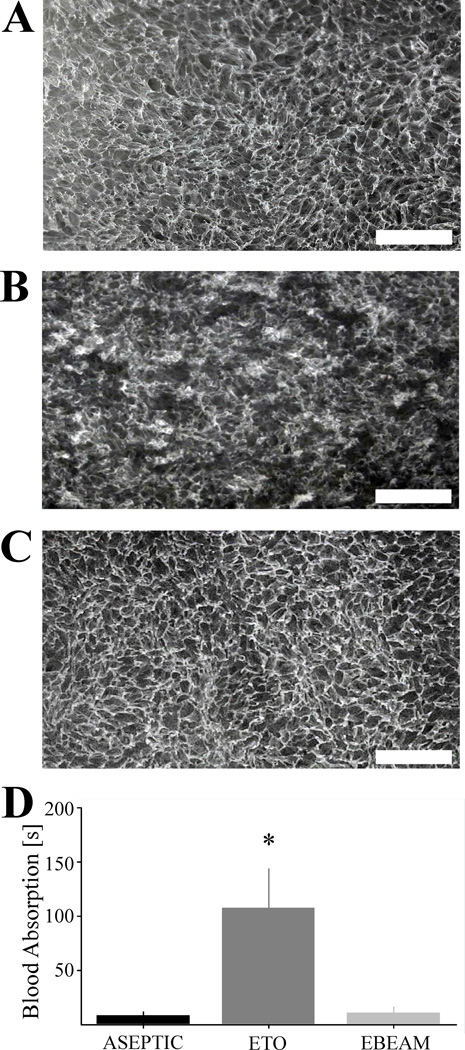
Figure 1. Macroscopic scaffold pore structure and blood absorption time.
A – Scaffold pore structure of representative ASEPTIC sample is homogenous and the pore walls well distinguishable and intact (white bar = 1 mm); B - Scaffold pore structure of representative ETO sample shows partially disrupted porous structure with collapsed pores (white bar = 1 mm); C - Scaffold pore structure of representative EBEAM sample is similar to the ASEPTIC group (white bar = 1 mm); D – Blood absorption time of ETO group significantly prolonged compared to ASEPTIC and EBEAM group (*, P< .001, d >1.26 for both comparisons)

