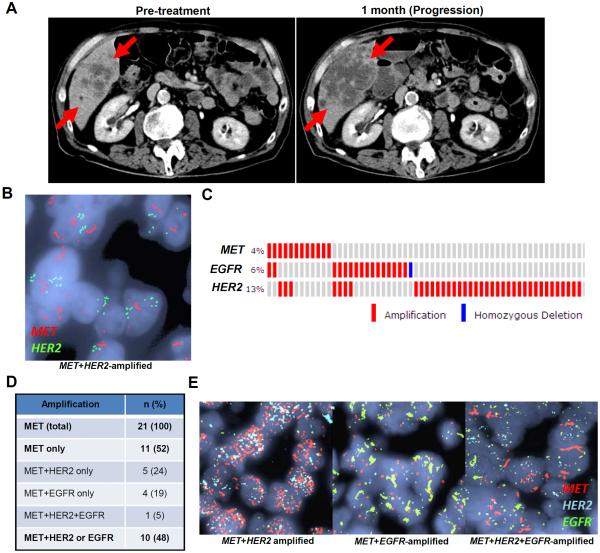
Fig. 2. Frequent co-amplification of RTKs in MET-amplified EGC.
(A) CT images of Patient #2 taken pre-treatment and upon disease progression one month after initiation of AMG337. Red arrows indicate tumor. (B) FISH images from Patient #2 showing co-amplification of MET and HER2 occurring in the same tumor cells. (C) Analysis of TCGA data showing co-occurrence of RTK amplification in EGC. (D) Multi-color FISH analysis of 21 MET-amplified EGC patients for co-amplification of HER2 and/or EGFR in the same tumor cells. (E) Representative multi-color FISH images from cases in (D).

