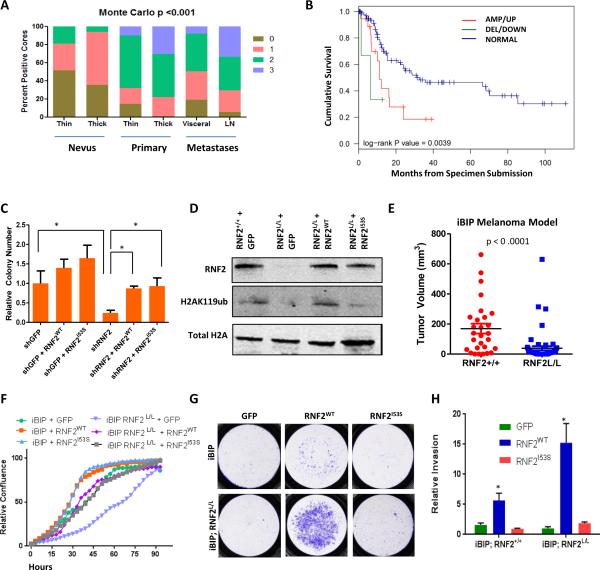
Figure 2. RNF2 promotes tumorigenesis in catalytic activity independent manner.
(A) Bar plot showing distribution of RNF2 immunoreactive intensity counts (0,1,2,3) in nevi (thin and thick), primary (thin and thick) and metastasis (visceral and lymph node). (B) Kaplan-Meier curve showing cumulative survival of three groups of patients defined by copy number change and expression in a TCGA cohort with available survival data (108): amplified/upregulated (AMP/UP, 12/18, Red), deleted/downregulated (DEL/DOWN, 2/4, Green) and no copy number/expression change (‘Normal’, 44/104, Blue). (C) Graph shows relative number of soft agar colonies in WM983B cells rescues with GFP, RNF2 wild type or catalytic mutant derivative (R70C or I53S) (* denotes significant change t-test p < 0.05). (D) Western blot showing levels of Rnf2, H2AK119ub and total H2A in iBIP mice tumor cells with (Rnf2+/+) or without RNF2 (Rnf2L/L) overexpressing GFP, RNF2WT and RNF2I53S. (E) Scatter plot showing ear tumor volume in iBIP mice with iBIP;RNF2+/+ or iBIP;RNF2L/L genotype after doxycycline (2mg/ml) administration and treatment with 4-hydroxytamoxifen (1μM). t-test p<0.0001. (F-H) (F) Proliferation assay, (G) Invasion assay images and (H) invasion assay quantitation in iBIP mice tumor cells with (Rnf2+/+) or without RNF2 (Rnf2L/L) overexpressing GFP, RNF2WT and RNF2I53S. Asterisk denotes significant change t-test p < 0.05.

