Figure 4.
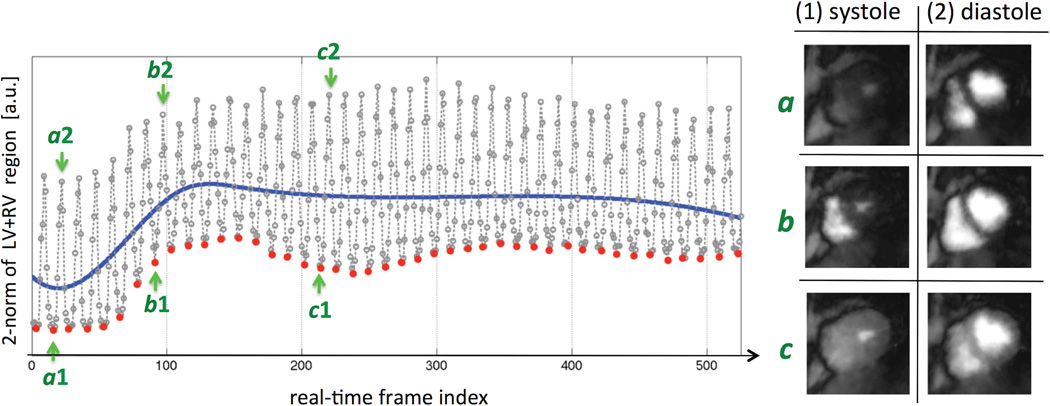
(Left): Example result for the automatic systolic-phase detection algorithm in Step 3 of the image reconstruction scheme, corresponding to a stress FPP scan in a CAD patient (the case presented in Fig. 8). The 1D plot is generated by calculating the 2-norm of the real-time nav reconstructed in Step 1 (frame rate: 25 frames/s) cropped to the automatically-detected ROI in Step 2 of the reconstruction scheme (consisting of both the left and right ventricles). Then, a 3-piece cubic B-spline curve (blue curve) is fitted to this 1D plot using nonlinear least-squares fitting, and the local minima in each of the detected intervals (intersection points with the blue spline curve) are identified as systolic-phase “time stamps” (red dots). The result is one systolic-phase time stamp per heartbeat, similar to R-wave tags in ECG-gated imaging but corresponding to the systolic phase. (Right): The corresponding real-time nav images generated in Step 1 of the reconstruction procedure at 3 different points in the 1D time curve shown on the left.

