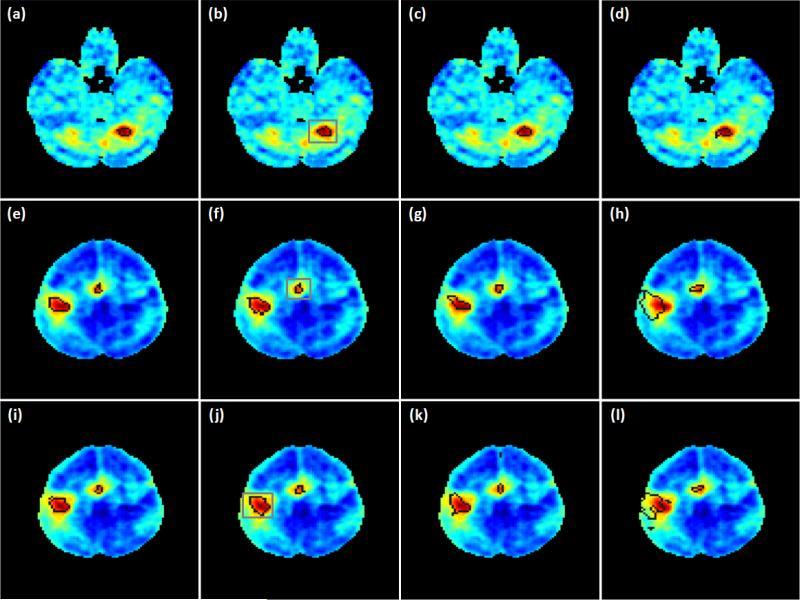
Figure 9.
Group level mapping results of the motor task fMRI data using the proposed method, GICA, and GLM-based method. (a)-(b), (e)-(f), (i)-(j) Active regions in the ipsilateral cerebellar, primary/pre-motor and supplementary motor cortex areas identified by the proposed method with ν values 2.0 (a, e, i) and 3.0 (b, f, j) times the originally estimated values. (c),(g),(k) GICA mapping results. (d),(h),(l) Mapping results of the GLM method. Dark lines indicate the boundaries of the identified active regions. The thresholds of GICA and GLM methods were selected to identify the same numbers of active voxels in the regions encircled by the grey lines as shown in (b), (f), and (j).

