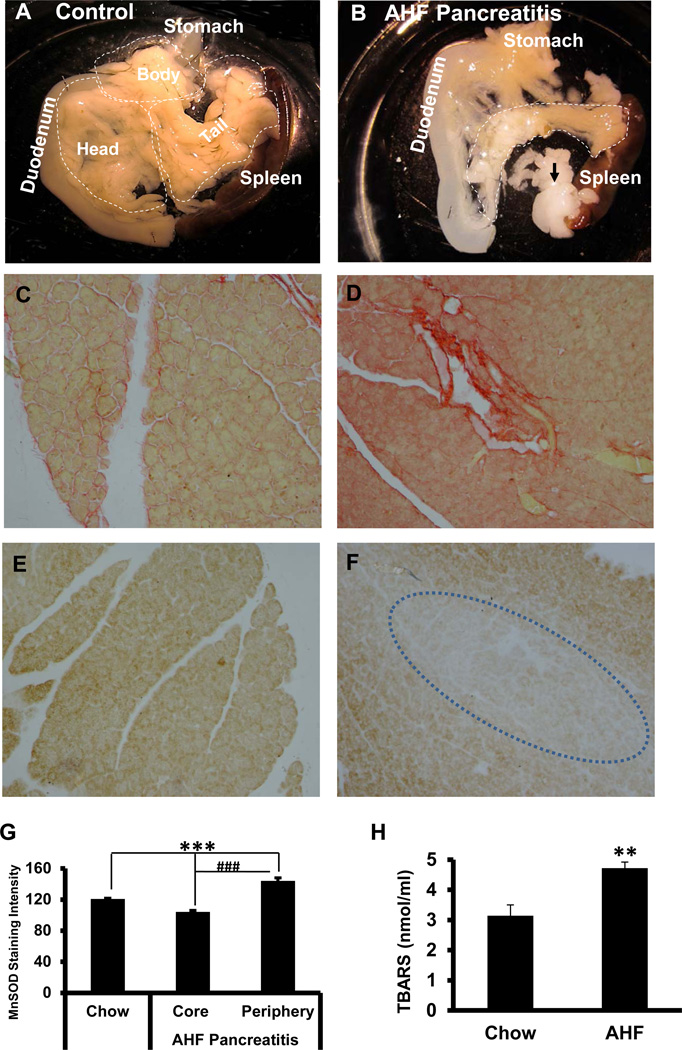
Fig. 1. Pancreas Anatomy, Histology and Oxidative Indices.
A. Control pancreas. The normal pancreas is a large diffuse glandular organ surrounded by duodenum, stomach and spleen. Gross divisions include the head (duodenal), body (biliary), and tail (gastro-splenic).
B. AHF induced pancreatitis. The pancreas of rats with AHF induced pancreatitis is smaller and more translucent, indicative of tissue loss. A large portion of the gland is replaced by fat (black arrows).
C. Sirius red fibrosis staining. Sirius red staining of control pancreas tissue shows minimal fibrous collagen.
D. Numerous fibrotic regions are localized with Sirius red staining in pancreatic tissue from rats with AHF induced pancreatitis.
E. MnSOD immunostaining intensity in pancreas. MnSOD immunoreactivity is present in the pancreatic tissue of control rats fed standard rodent chow. F. Sparse MnSOD immunoreactivity is observed in the core of the pancreatic lobes in rats with AHF induced pancreatitis suggesting decreased mitochondrial anti-oxidative capacity. G. The bar graph shows quantitation of the pancreatic tissue staining intensity of the MnSOD immunoreactivity among groups (n=4/group; *** p<0.001, standard chow vs. injury core and periphery of pancreas in AHF fed rats; ### p< 0.001, pancreas core vs. periphery).
H. Plasma TBARS The metabolic byproduct thiobarbituric acid reactive substances (TBARS) in blood plasma, an indicator of lipid peroxidation, is significantly increased in rats with AHF induced pancreatitis (** p<0.01, chow vs. AHF fed, t-test).

