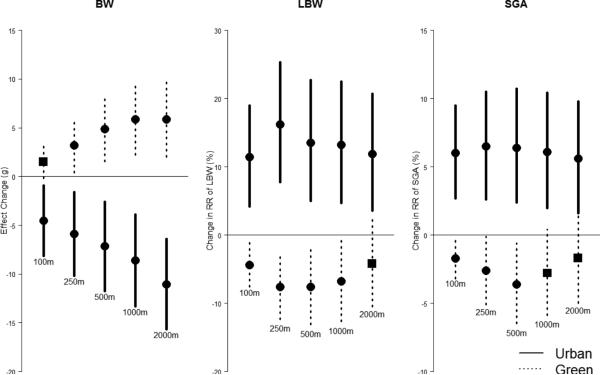
Figure 1. Associations between land-use and birth weight per IQR increase in urban or green space with different buffer sizes.
Effect estimates are gram for birth weight and percent change for LBW and SGA. Land-use effect estimates are per IQR increase of corresponding buffer size (Table 2). Dots represent point estimates, and vertical lines show the 95% confidence intervals. Black circles indicate p-value <0.05, and black square shows p-value ≥0.05. Each model includes a single land-use variable and covariates.

