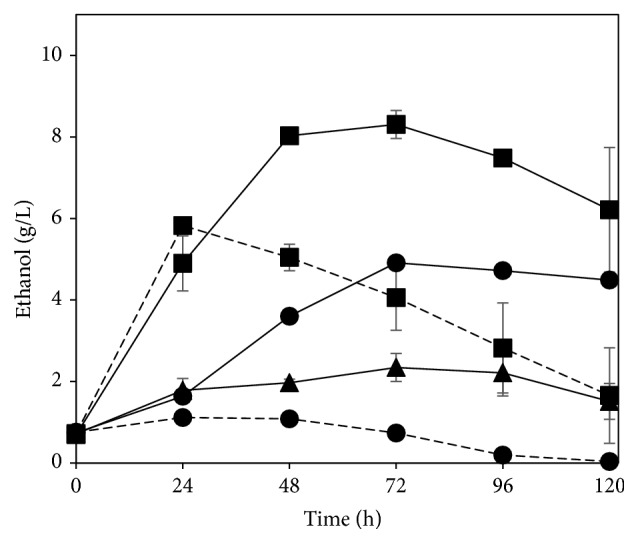
Figure 5.

Ethanol profiles during cultivation in whole stillage without cellulase (circles) and with addition of 1 FPU cellulase/g SS (squares) with N. intermedia (straight lines) and S. cerevisiae (dashed lines) or their coculture (triangles). Error bars represent two standard deviations.
