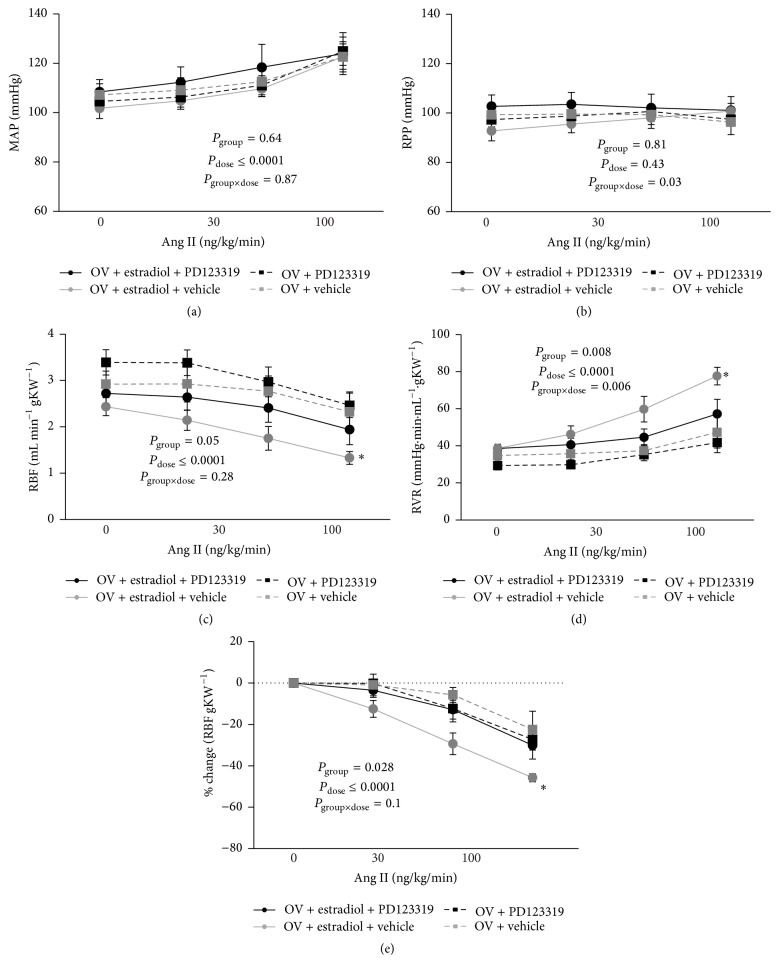
Figure 2.
Effects of vehicle or PD123319, on responses to Ang II infusion. Data are shown as mean ± SEM. The data for RBF are also presented as percentage change from baseline. P values were derived from repeated measures ANOVA with factors group, dose (of Ang II), and their interaction. ∗ represents P ≤ 0.05 for comparison of the response to 300 ng/kg/min in ovariectomized rats treated with estradiol and the vehicle for PD123319 compared with all other groups, derived from Tukey's post hoc test. n = 5 per group. MAP, mean arterial pressure; RPP, renal perfusion pressure; RBF, renal blood flow per gram kidney weight; RVR, renal vascular resistance; OV, ovariectomized group.

