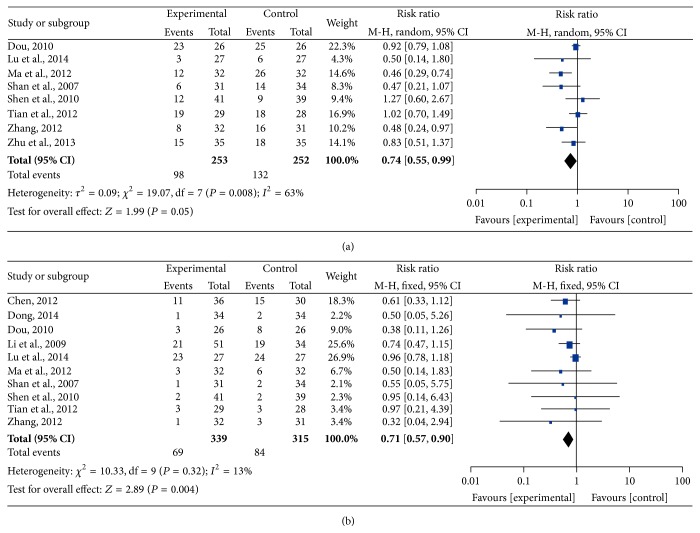
Figure 7.
Forest plots of the impact on leukopenia. (a) represents the random-effects model of the risk ratio (95% CI) of grade I–IV leukopenia associated with CHM-containing versus non-CHM-containing regimens; (b) represents the fixed-effects model of the risk ratio (95% CI) of grade III-IV leukopenia associated with CHM-containing versus non-CHM-containing regimens.

