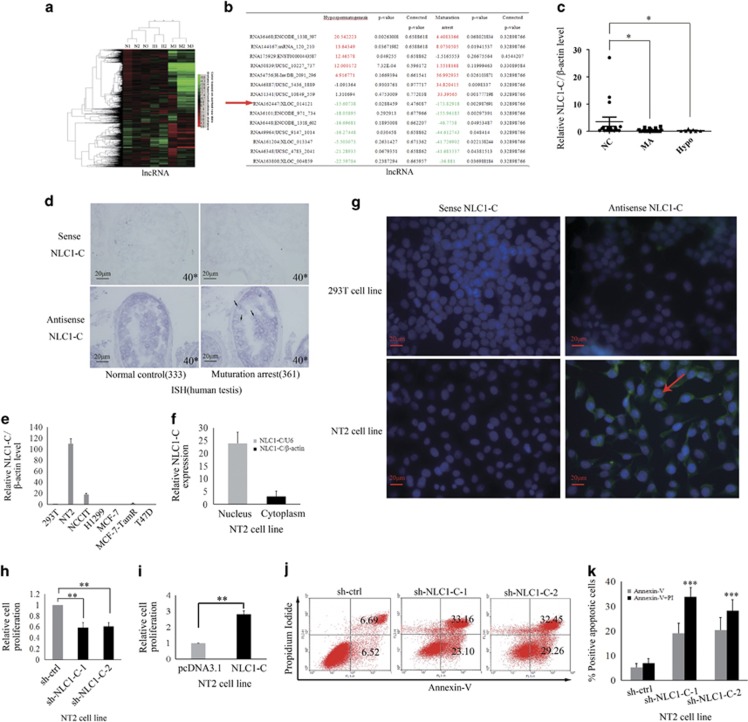
Figure 1.
NLC1-C is down-regulated in NOA (MA and Hypo) patients and silencing of endogenous NLC1-C represses NT2 cell proliferation and promotes cell apoptosis. (a) The cluster heat map shows lncRNAs with an expression change fold >4 from microarray data (P<0.025) in NOA patients compared with controls. N, controls; H, Hypo patients; M, MA patients. (b) The data provided in the table represent the lncRNAs that were found to be desregulated significantly in NOA patients compared with controls. NLC1-C in the table is marked with a red arrow. (c) Quantitative real-time PCR analysis confirmed the microarray data: NLC1-C was down-regulated in NOA patients. (d) Localisation of NLC1-C in the testes of normal controls and maturation arrest patients by DIG-labelled RNAs by in situ hybridisation. The accumulation of NLC1-C in the nucleus is indicated by the black arrow. (e) Quantitative real-time PCR detection of NLC1-C expression in indicated human cell lines. Data are normalised to β-actin expression and HEK293 T (293 T) was set to a value of 1. (f) NLC1-C was localised in both the nucleus and cytoplasm of NT2 cells. Quantitative real-time PCR examination of NLC1-C expression in both the nucleus and cytoplasm of NT2 cells. Data are normalised to U6 expression in the nucleus and β-actin expression in the cytoplasm, respectively. (g) RNA FISH assay of NLC1-C localisation in 293T cell and the testicular embryonal carcinoma cell line NTERA-2 (NT2). Scale bars, 20 μm. DAPI, 4′,6-diamidino-2-phenylindole. (h and i) Silencing and overexpression of NLC1-C inhibited and promoted cell proliferation. (j and k) Silencing of endogenous NLC1-C promoted cell apoptosis (j) and the proportions of cells apoptotic rates was shown in (k). Proportions of cells apoptotic rates were determined using flow cytometry. Error bars indicate S.E.M. (n=3). *P<0.05, **P<0.01, ***P<0.001 (two-tailed Student's t-test), compared with negative controls

