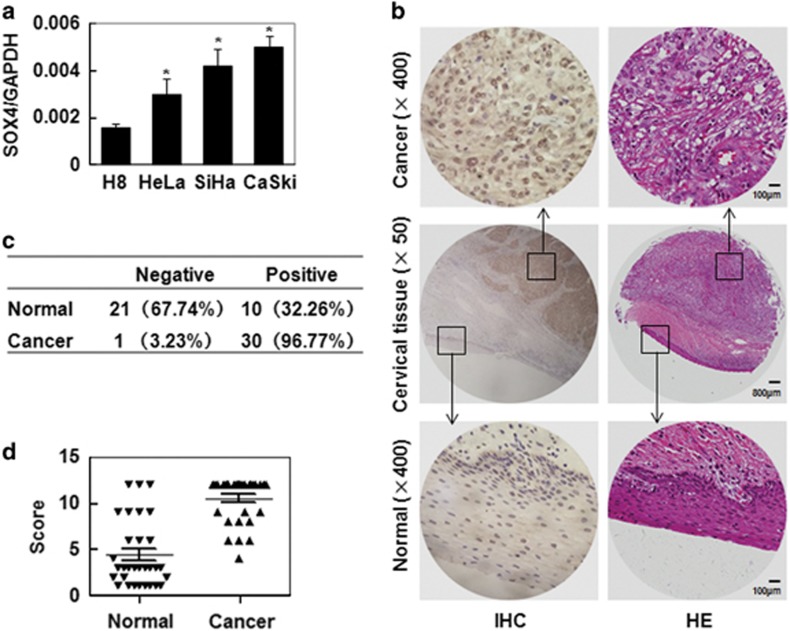
Figure 1.
SOX4 expression in cervix cancer cells and tissues. (a) qRT-PCR analysis of SOX4 mRNA levels in one normal cervical cell line (H8) and three CC cell lines (HeLa, SiHa and CaSki). (b) Representative HE straining and immunohistochemistry (IHC) analysis of SOX4 expression in normal cervical tissue and CC tissue. (c) SOX4 staining in 31 cervical squamous cancer specimens and their paired normal cervical epithelial tissues adjacent to cancer. (d) A comparison of the IHC scores of SOX4 staining in normal cervix and cervical squamous cancer. SOX4 relative expression levels of each specimen were shown as the means±S.E. in NC and ICC groups. *P<0.05 compared with the normal tissue group

