Figure 1.
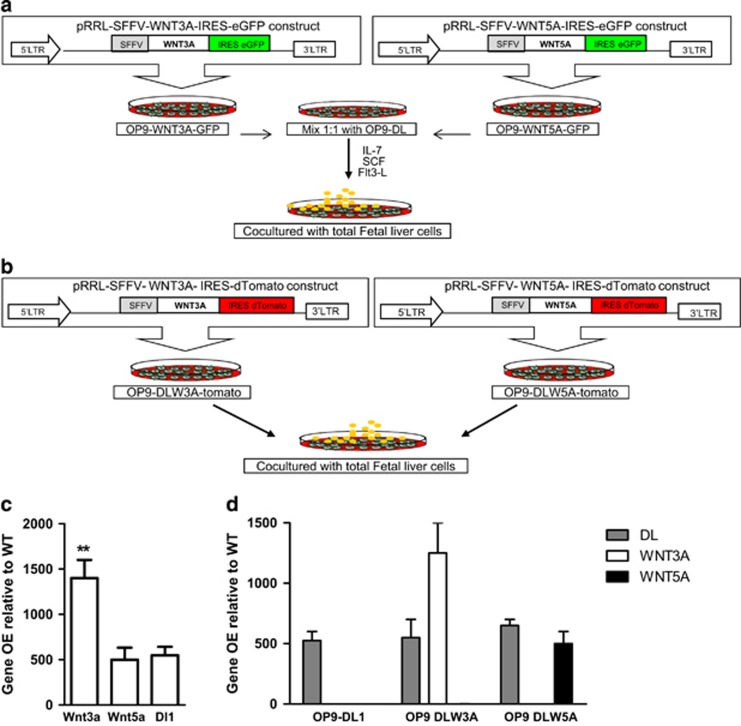
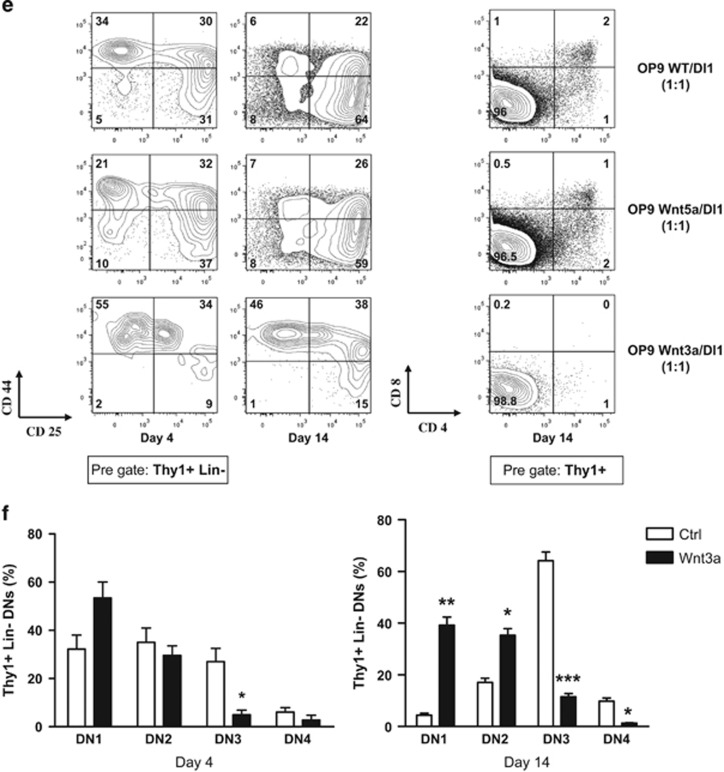
Canonical Wnt3a overexpression blocks T-cell development at early stages. (a) Experimental design. OP9-WT cell lines were transduced with pRRL-SFFV-Wnt3a-GFP or pRRL-SFFV-Wnt5a-GFP lentiviral constructs, selected by cell sorting on high GFP expression and for experiments mixed with OP9-Dl1-GFP. Stem cells from E14 fetal liver cells were co-cultured with OP9-WT/Dl1 mixed 1:1 as a control, or OP9-Wnt3a/Dl1 1:1, or OP9-Wnt5a/Dl1 1 : 1 for 14–21 days in aMEM 10% FCS in presence of IL-7, SCF and Flt3 L cytokines. (b) Experimental design. OP9-Dl1-GFP cell lines were transduced with pRRL-SFFV-Wnt3a-tomato (DLW3A) or pRRL-SFFV-Wnt5a-Tomato (DLW5A) and selected by cell sorting on high GFP expression. Stem cells from E14 fetal liver cells were co-cultured with OP9-Dl1 as a control, OP9-DLW3A or OP9-DLW5A for 14 days in aMEM 10% FCS in presence of same cytokines. (c) RTq-PCR analysis was performed to determine overexpression of Wnt3a (left bar), Wnt5a (middle bar) and Dl1 gene (right bar) in transduced OP9 cell lines. The levels of expression are normalized by ABL-2 expression and presented as fold induction relative to untransduced OP9 cell line. (d) The overexpression of Dl1 gene (gray bars), Wnt3a gene (white bars) and Wnt5a gene (black bars) in untransduced OP9DL1 cell line (left), OP9-DLW3A cell line (middle) and OP9-DLW5A (right) are shown. The levels of expression are normalized by ABL-2 expression and presented as fold induction relative to untransduced OP9 cell line. (e) Total fetal liver cells were co-cultured with OP9-WT/DL1 : 1 as control (top row), OP9-Wnt5a/DL1:1 (middle row) or OP9-Wnt3a/DL1 : 1 (bottom row). Cells were harvested 4 days and 14 days after co-culture and were analyzed flow cytometric for DN stages of T-cell development. The plots are pre-gated for Thy1+ and LIN- markers. Lineage markers include CD3e, CD4, CD8a, CD11b, Gr1, B220, NK1.1 and Ter119. The percentage of each population is indicated. (f) Collective data of total experiments from (e) are depicted. Total fetal liver cells are co-cultured with OP9-WT/DL1 : 1 as control (white bars) or with OP9-Wnt3a/DL11 : 1 (Black bars). Cells were harvested at day 4 and day 14 of co-culture and were assessed by FACS for DN stages of T-cell development. The percentage of each stage is shown within Thy1+ Lin– population. Data are mean±S.D. of nine control and eight Wnt3a samples from three independent experiments. *P<0.05; **P<0.01; ***P<0.001


