Figure 3.
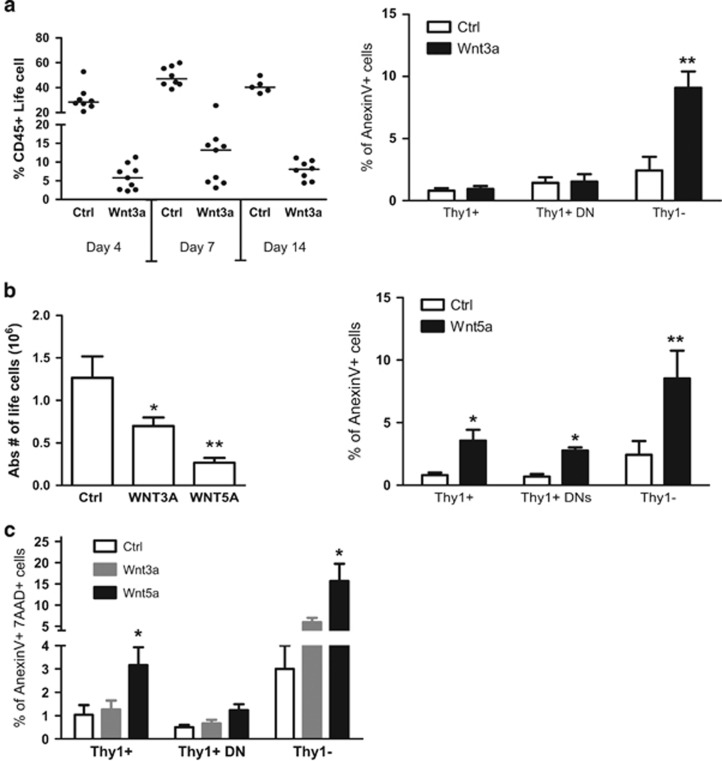
Wnt5a overexpression results in apoptosis in developing thymocytes. (a) Total fetal liver cells were co-cultured with OP9-WT/DL1 : 1 (Ctrl) or with OP9-Wnt3a/DL1 : 1 (Wnt3a) or with OP Wnt5a/Dl1 (Wnt5a). In the left graph, the percentage of total CD45+ life cells were assessed by FACS after 4 days, 7 days and 14 days of co-culture. The averages are indicated by a dash. Each dot represents one mouse. In the right graph, the percentage of AnexinV+ apoptotic cells is shown in specified populations after 14 days of co-culture with OP9-WT/DL (white bars) or with OP9-Wnt3a/DL (black bars). Error bars represent mean±S.D. from two independent experiments (each in triplicates). (b) In the left graph, the absolute number of life cells is shown after 14 days of co-culture. Error bars represent mean±S.D. from two independent experiments (each in triplicates). In the right graph, the percentage of AnexinV+ apoptotic cells is shown in specified populations after 14 days of co-culture with OP9-WT/DL (white bars) or with OP9-Wnt5a/DL (black bars). Error bars represent mean±S.D. from two independent experiments each in triplicates. (c) Percentage of AnexinV+AAD7+ cells representing dead cells in the culture gated on tall thymocytes, DN thymocytes and non-T lineage cells in thymic cultures with Wnt3a or Wnt5a expressed in OP9-DL1 cells. *P<0.05; **P<0.01; ***P<0.001

