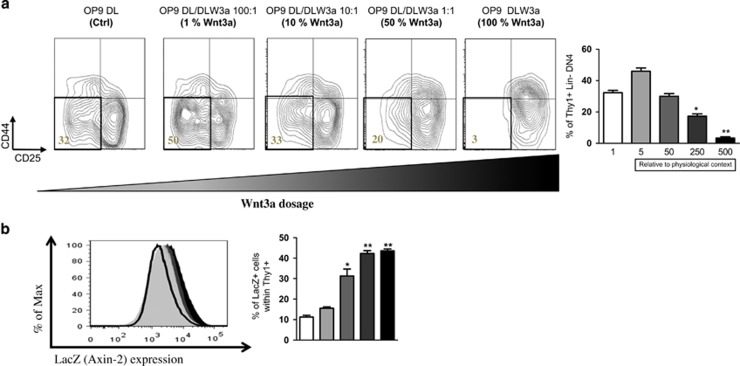
Figure 4.
Optimal dosage of canonical Wnt signaling accelerates T-cell development. (a) Total FL cells were co-cultured for 14 days with OP9-DL1, or different ratios of OP9-DLW3A/ OP9-Dl1 mixture as indicated. Cells were then harvested and were analyzed by FACS for DN stages of T-cell development. The percentage of CD44− CD25− DN4 is indicated. The plots are pre-gated on Thy1+ LIN– markers. Error bars represent mean±S.D. of one independent experiment in triplicates. Below the bar graphs Wnt3a gene overexpression relative to the physiological levels are indicated. (b) Total FL cells from Axin2 LacZ (wnt reporter mice) were co-cultured with OP9-DL1 and different ratios of OP9-DLW3A as previously indicated. Cells were harvested and β-galactosidase (LacZ) activity in Thy1+ cells was measured. Quantification of the mean fluorescence intensity (MFI) of Thy1+ cells is shown (left). Quantification of the frequency of LacZ+ cells is shown (right). Littermate mice not carrying the reporter transgene (Axin2 +/+) were used to define the LacZ– population. Data represent four Axin2 +/− mice and two Axin2 +/+ control mice. Error bars represent mean±S.D. *P<0.05; **P<0.01; ***P<0.001

