Figure 5.
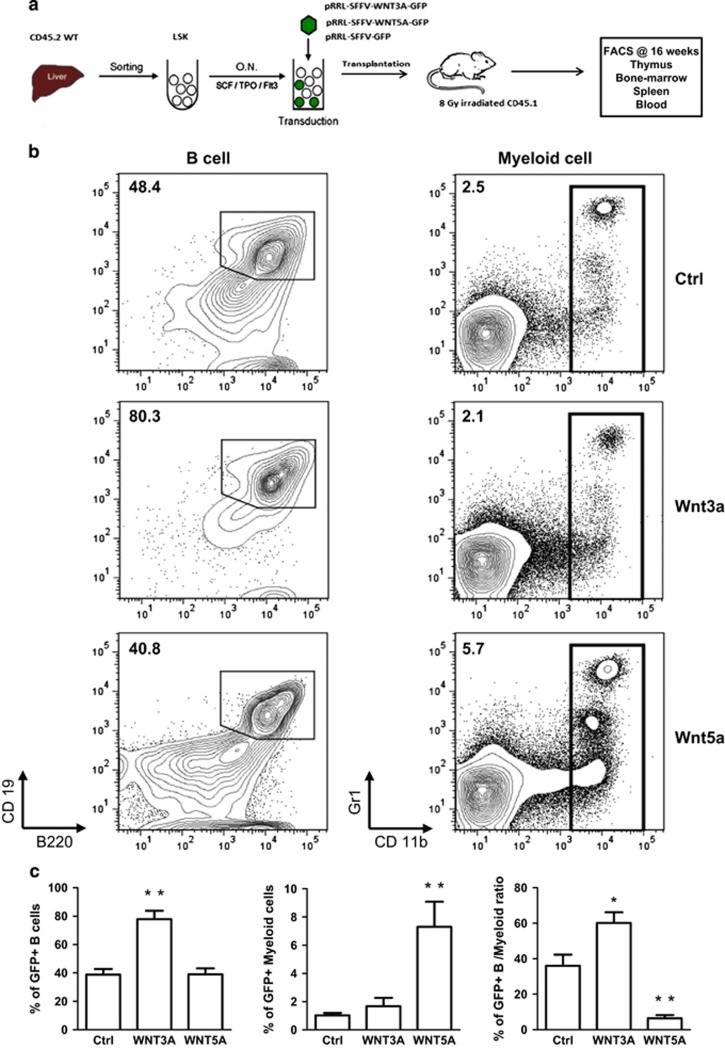
Wnt3a overexpression enhances lymphopoiesis, whereas Wnt5a overexpression augments myelopoiesis in vivo. (a) Experimental design. Lin– Sca1+ Kit+ (LSK) cells were sorted from E14 WT FL and were stimulated overnight in medium with SCF, TPO and Flt3-L cytokines. Next day, the cells were transduced with pRRL-SFFV-GFP (Ctrl), pRRL-SFFV-Wnt3a-GFP (Wnt3a) or pRRL-SFFV-Wnt5a-GFP (Wnt5a). Bulk of transduced cells were transplanted intravenously into CD45.1 8 Gy irradiated recipients. At week 16 post transplantation, the mice were killed and blood, spleen, BM and thymus were harvested and were assessed by FACS. Each group consists of five mice. (b) Representative FACS plots of B cell (B220+ CD19+) and myeloid cells (CD11b+ G1+) in the spleen of a recipient mouse 16 weeks after transplantation. The cells are pre-gated on CD45.2+ CD45.1− and GFP+. The numbers indicate percentage of cells within the gate. (c) Collective data represent the percentage of GFP+ B cells (left graph), myeloid cells (middle graph), and the ratio of B cells versus myeloid cells in the spleen of each group. Data are mean±S.D. of five mice per group. *P<0.05; **P<0.01; ***P<0.001

