Figure 6.
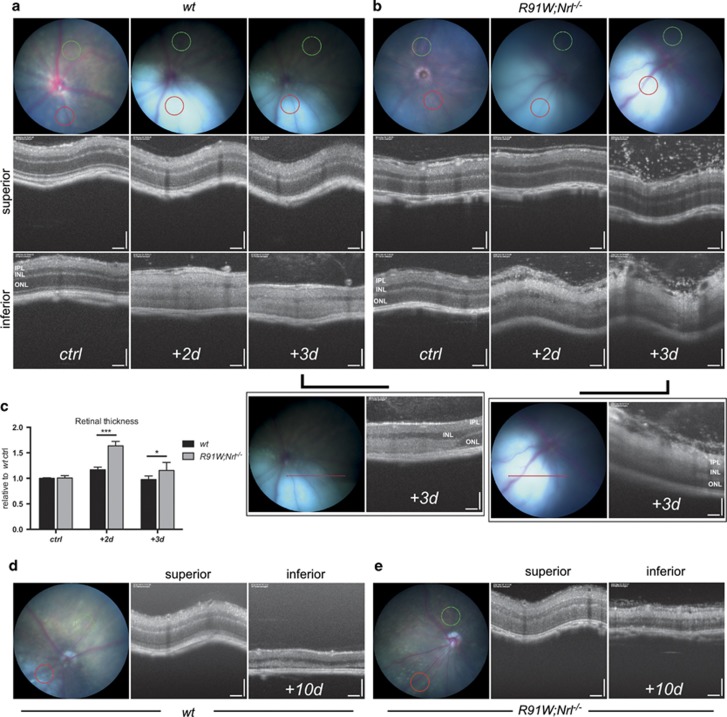
Fundus (color) and corresponding OCT (black and white) images of wt (a, d) and R91W;Nrl−/− (b, e) mice taken up to 10 days following BLD. The positions of OCT scans are shown in fundi as colored circles/lines (green, superior; red, inferior). At 2 and 3 days after BLD the hotspot regions appeared as a pale bluish spot, much lighter than the rest of the fundus (a, b). OCT revealed that INL and ONL in the damaged (inferior) but not the control area (superior) became hyperreflective in wt; whereas hyperreflectivity was very pronounced in the IPL but absent in the ONL in R91W;Nrl−/− mice. Boxed panels in (a) and (b) show linear scans of the transition zones analyzed 3 days following BLD. Increased retinal thickness was especially prominent in R91W;Nrl−/− mice. Quantification of retinal thickness in R91W;Nrl−/− and wt eyes that were unexposed (ctrl) or exposed to blue light, as indicated (c). Values are expressed relative to mean value of unexposed wt mice that was set to 1 (N=4 wt, 5 R91W;Nrl−/−; *P<0.05; ***P<0.001). At 10 days after BLD the hotspot regions can be recognized by whitish material appearing in the fundus and by a thinned retina in OCT (d, e). Note: the second and third time points in panels (a) and (b) show data from the same mouse followed for two consecutive days. Scale bars 100 μm

