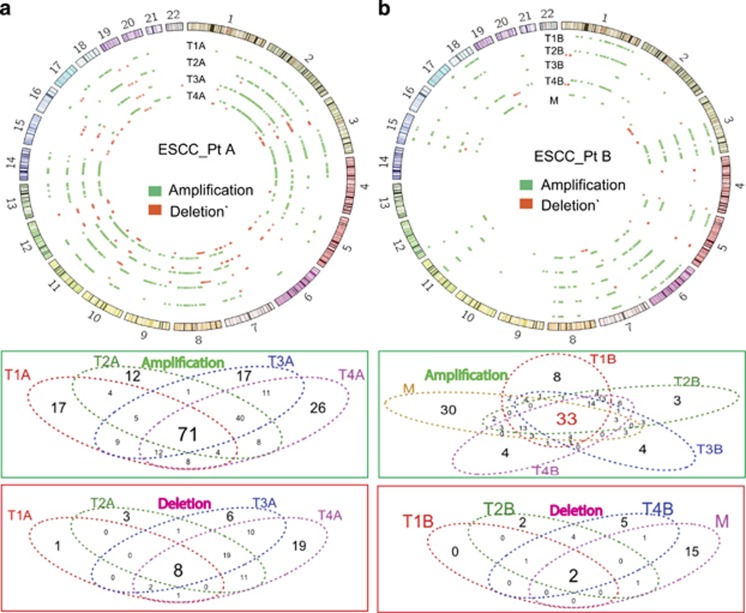
Figure 2.
Intratumoral genomic copy number alterations of ESCC detected by aCGH. Genomic copy number alterations relative to non-tumor tissues in PtA (a) and in PtB (b) were plotted with Circos plot. Green color represents copy number amplification (Amp); Red color represents copy number deletion (Del), in each region of a given ESCC tissue. The total copy number alterations (Amp+Del): 403 in PtA, 262 in PtB. The Venn diagrams show the overlap of Amp or Del between each tumor region from PtA and PtB.

