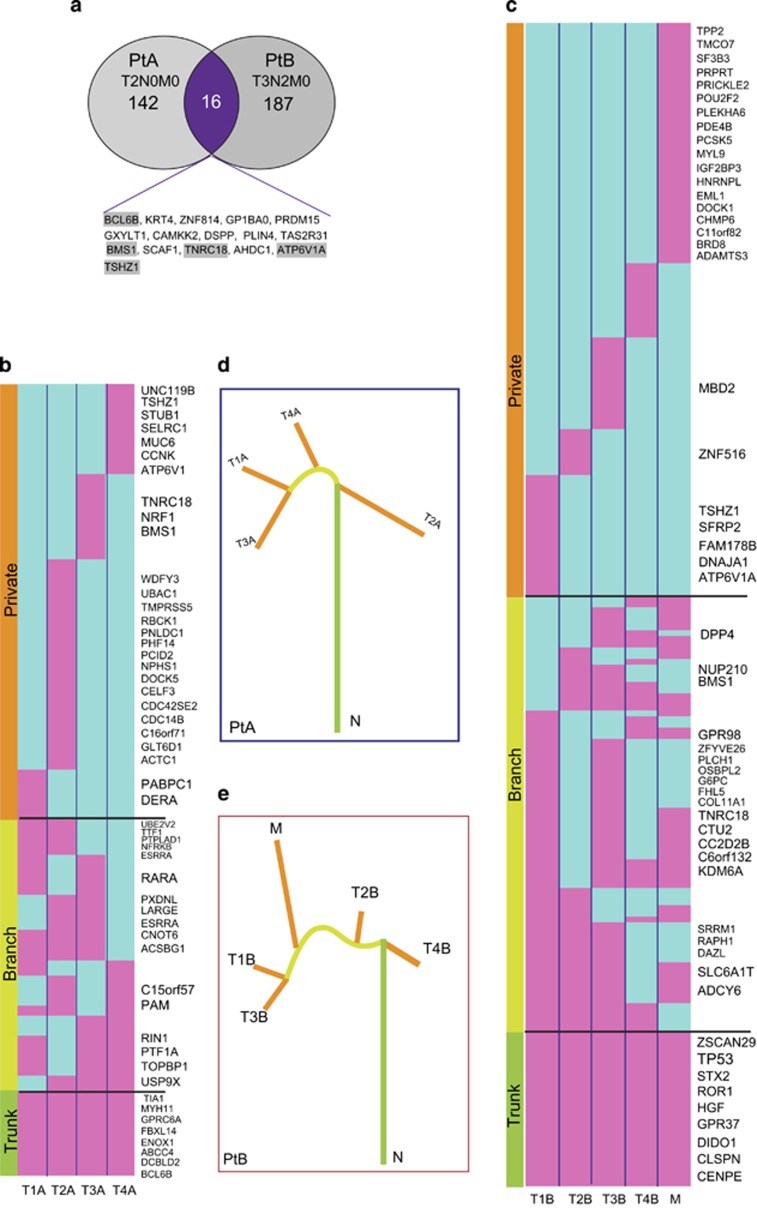
Figure 3.
Characterization of non-silent mutations in multiple regional samples of ESCC. (a) Overlap of non-silent mutation affected genes between PtA (n=158) and PtB (n=203). (b, c) Heatmaps show the regional distributions of non-silent mutations in PtA and PtB; presence (pink), absence (light blue) is indicated for each tumor region. Gene mutations in all regions of a tumor shown with green bar, designated as ‘Trunk' gene mutations in some regions of a tumor shown with yellow bar (‘Branch'); gene mutations in only one regions of a tumor shown with orange bar (‘Private'), mutated cancer genes are listed on the right of the heatmaps. (d, e) Phylogenetic trees generated using the Ape and Phangorn packages in R based on the distribution of all detected mutations; trunk and branch lengths are proportional to the number of non-silent mutations in each tumor region.

