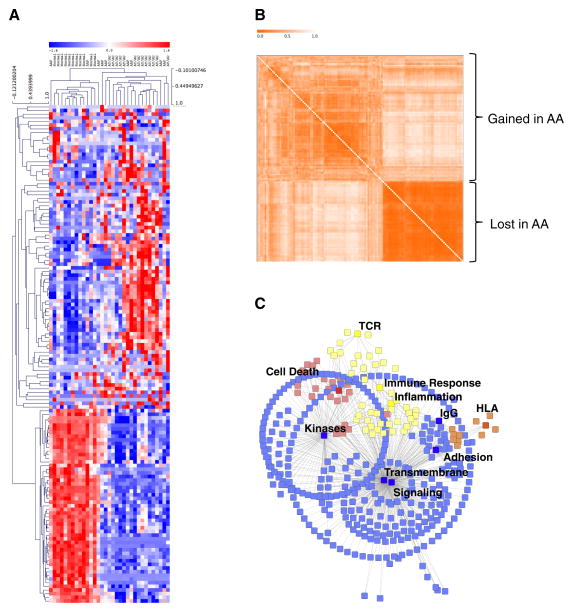
Figure 1. Gene expression analysis identifies mixed-tissue gene signatures.
(A) Unsupervised hierarchical clustering of a cohort of Alopecia Areata patchy (AAP), totalis/universalis (AT/AU), and unaffected controls (Normal) using the Alopecia Areata gene signature (AAGS). Blue, underexpression; Red, overexpression. (B) Gene co-similarity matrix showing gene clusters. Stronger orange indicates lower dissimilarity in gene expression. Clusters over- and under-expressed in Alopecia Areata are indicated. (C) Graphical representation of genes in the signature and the statistically enriched functional categories associated with them. Blue indicates signaling pathways; yellow, immune/inflammation pathways; orange, HLA; and red indicates cell death pathways. Pathways at p<0.05 FDR corrected were kept for this analysis.

