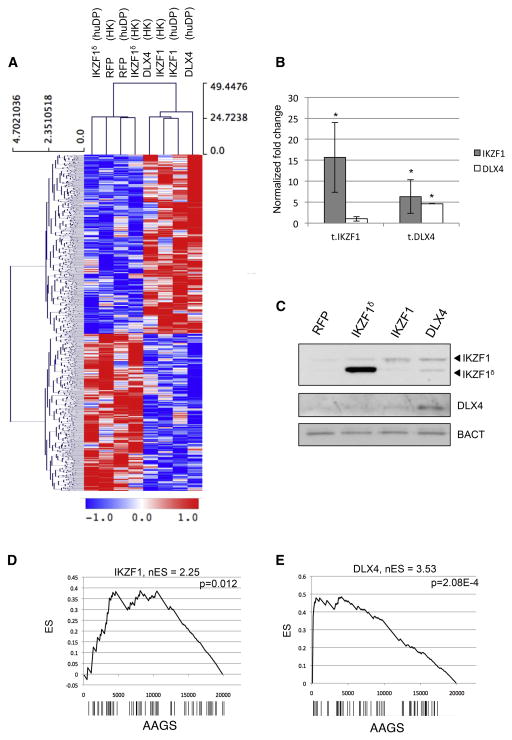
Figure 3. Exongeous expression of IKZF1 and DLX4 induces a context-independent AA-like gene expression signature.
(A) Two-dimensional hierarchical clustering of gene expression measured in human dermal papillae (huDP) and HACAT keratinocytes (HK) transfected with plasmid vectors expressing IKZF1, DLX4, or controls expressing RFP and IKZFδ, an isoform lacking DNA binding domains. The treatment type and cell type for each experiment are indicated at the top of the heatmap. Blue indicates decreased expression and red indicates overexpression. (B) Analysis of IKZF1 and DLX4 mRNA expression in transfected cells in quadruplicate, represented as average ±SEM, normalized to B-actin (C) Western blot confirming IKZF1 and DLX4 proteins. GSEA plots measuring the specificity of AA-like response assayed by differential expression of the AAGS following (D) IKZF1 or (E) DLX4 overexpression. Genes are ranked left to right from most- to least-differentially expressed on the x-axis, barcodes represent the positions of IKZF1 and for DLX4 signature genes. The Enrichment Score (ES) is shown in the plot, and the normalized Enrichment Score (nES) is displayed at the top. The nES is derived from the ES at the “leading edge” of the plot—that is, the first maximal ES peak obtained. The p-value is computed for the nES compared against a randomized null distribution.

