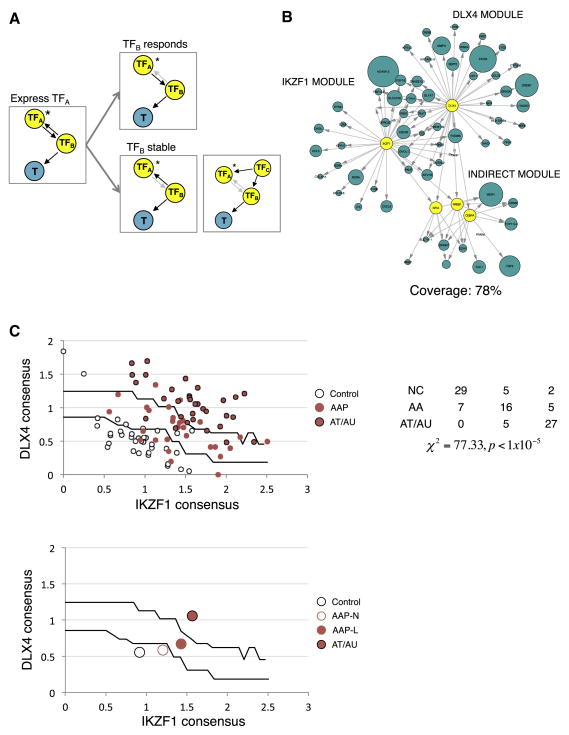
Figure 5. The fully reconstructed master regulator module predicts both immune infiltration and severity.
(A) Using the exogenous expression data, it is possible to infer both direct transcriptional MR targets (MR → T), as well as targets regulated by TFs that are targets of the MR (MR → TF → T). Any TF (TFB) that is paired with MRs IKZF1 or DLX4 (TFA) and that exhibits changes in expression upon overexpression of the TFA is regulated by the TFA. Subsequently, any genes (T) in the AAGS that are linked to TFB are secondary targets of TFA (TFB responds). Any TFB that does not respond to transfection of TFA is not regulated by the TFA, so either TFB regulates TFA (TFB stable, left) or both are co-regulated by a third, TFC (TFB stable, right). (B) Using this approach, 78% of AAGS can be mapped to IKZF1 or DLX4 within one indirect TFB. Blue nodes represent AAGS genes that respond to IKZF1 or DLX4 expression, size of nodes scaled to the fold change experimentally observed (only nodes having at least 25% change are shown) (C) Using these targets, we generate single numeric scores of IKZF1 and DLX4 transcriptional activity and used them to create classifiers for AA severity. AA samples are then imposed over the search space to assess accuracy (top chart). The table provides quantitation and statistics for separation of presentations across territories in the search space (NC:unaffected, AAP:patchy AA, AT/AU: totalis/universalis). Centroid representations can be used to show how populations transition into disease states by moving across the trained boundaries (bottom chart; AAP-N: nonlesional, AAP-L: lesional).

