Figure 4.

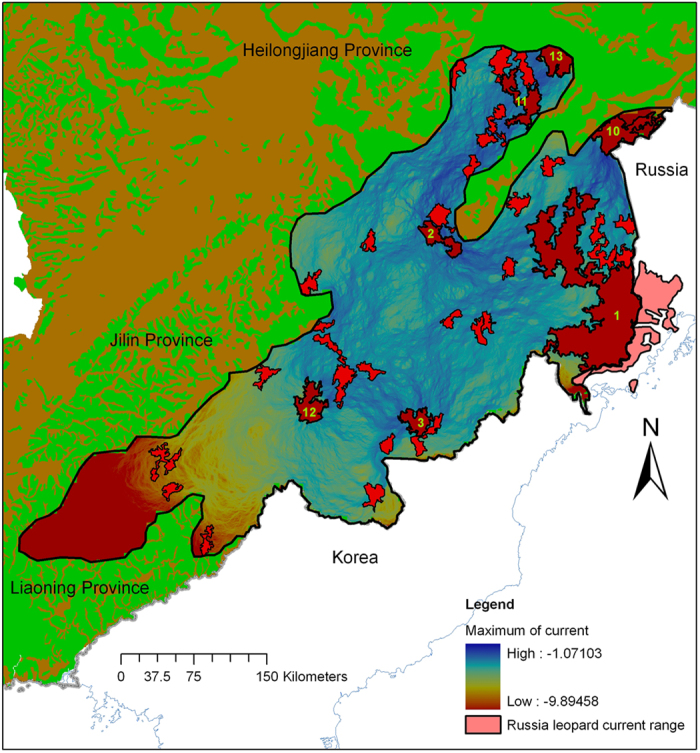
Habitat connectivity map among the suitable habitat patches based on the Circuitscape 4 Software analysis. Yellow numbers identify the big suitable patches >500 km2 derived from the distribution model.

Habitat connectivity map among the suitable habitat patches based on the Circuitscape 4 Software analysis. Yellow numbers identify the big suitable patches >500 km2 derived from the distribution model.