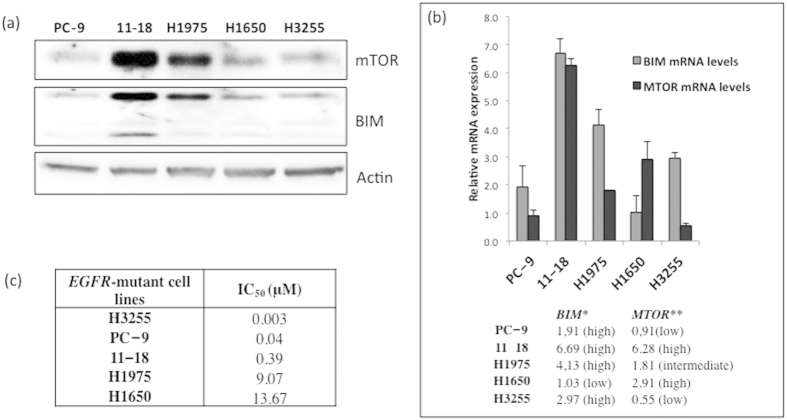
Figure 3. The IC50 values for gefitinib in EGFR-mutant lung adenocarcinoma cell lines are associated with basal BIM and mTOR expression (protein or mRNA).
(a) mTOR and BIM expression in EGFR-mutant lung adenocarcinoma cell lines. Lysates were prepared and run on gels for western blot with specific antibodies. Actin was used as the loading control. Among the three sensitive EGFR-mutant lung adenocarcinoma cell lines, H3255, PC-9 and 11–18, 11–18 is the one with the highest mTOR and BIM protein expression. (b) MTOR and BIM mRNA expression in EGFR-mutant lung adenocarcinoma cell lines by qRT-PCR normalized to β-actin. Among the three sensitive EGFR-mutant lung adenocarcinoma cell lines, H3255, PC-9 and 11–18, 11–18 has the highest MTOR and BIM mRNA expression. PC-9, 11–18 and H1975 cells have high BIM mRNA expression. H1650 cells have low BIM mRNA expression. The two gefitinib resistant EGFR-mutant lung adenocarcinoma cell lines, H1975 and H1650, have intermediate and high MTOR mRNA expression levels, respectively. Values are the mean ± standard deviation of triplicate experiments. *BIM low, <1.83; BIM intermediate, 1.83-2.96; BIM high, >2.96; MTOR low, <0.91; **MTOR intermediate, 0.91-1.97; and MTOR high, >1.97. Error bars indicate the standard deviation. (c). The IC50 values for gefitinib increase in the three sensitive EGFR-mutant lung adenocarcinoma cell lines, H3255, PC-9 and 11–18, as mTOR expression increases (protein or mRNA). 11–18 are sensitive cells with the highest mTOR expression and IC50 value for gefitinib 0.39 μM, a concentration more than 100-fold higher compared to H3255 cells that have the lowest mTOR expression and are hypersensitive to gefitinib (IC50 0.003 μM).

