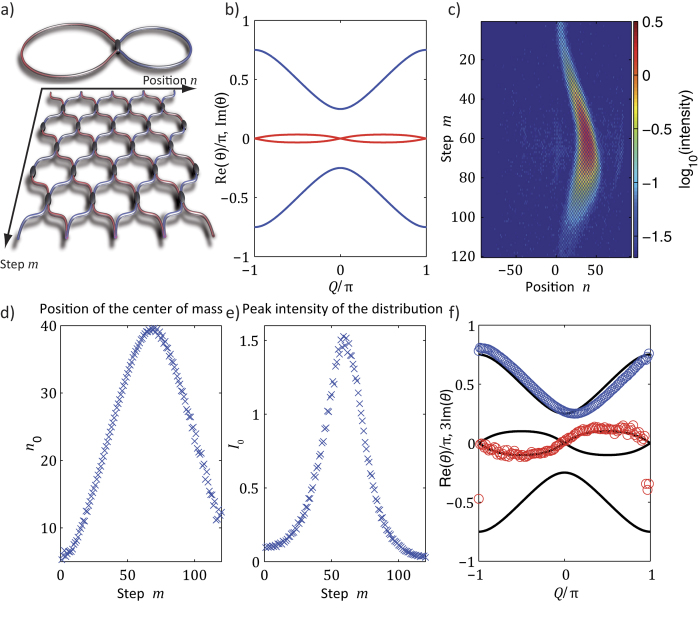
Figure 5. Experimental reconstruction of the band structure of a locally PT-symmetric mesh system by analyzing Bloch oscillations.
(a) To implement a locally PT lattice, only pulses in the long loop are amplified, while the pulses in the short loop are attenuated ( ). (b) the resulting band structure is complex over the entire Brillouin zone (blue and red correspond to real and imaginary part). (c) Observed Bloch oscillations for
  . (d) Estimated position of the wavepacket’s center of mass. In this figure, the horizontal axis is mapped onto the Bloch momentum
  by evaluating Eq. 4. (e) The peak power of the Gaussian packet depends on the position within the Brillouin zone during Bloch oscillations. (f) Reconstructed band structure of this locally PT-symmetric lattice (imaginary part is magnified by a factor of 3 for better visibility).

