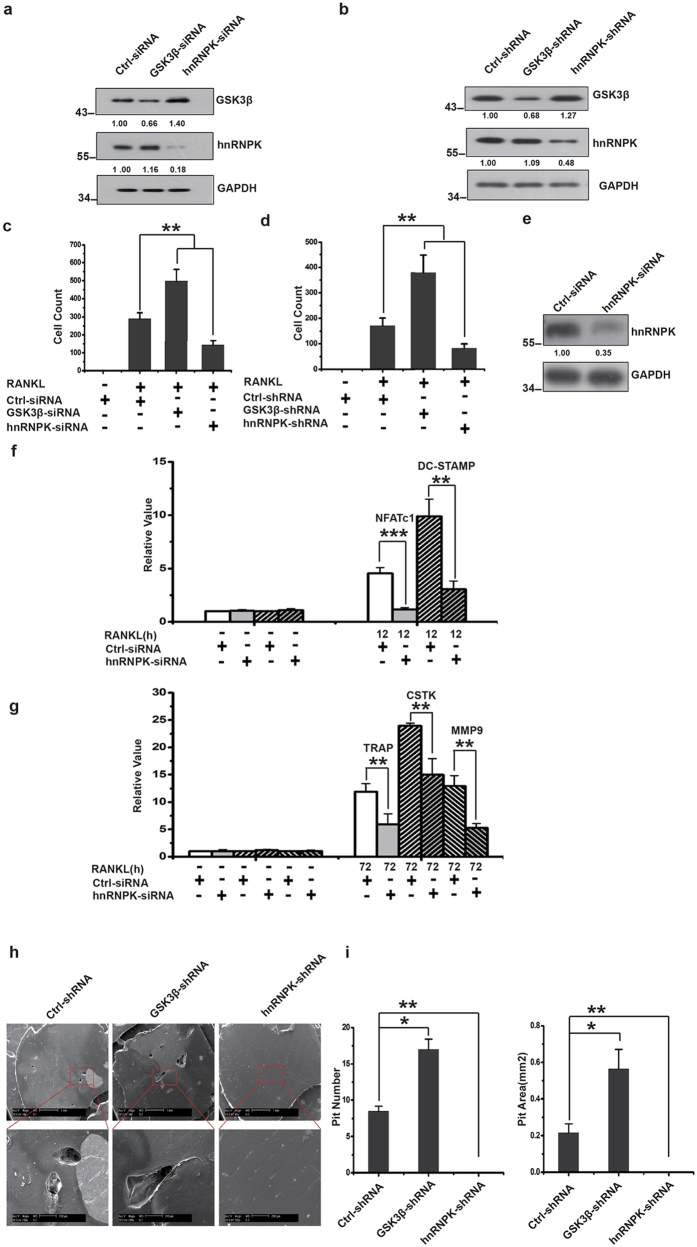
Figure 5. hnRNPK is essential for the RANKL-induced osteoclast differentiation.
(a) Western blotting showing the effect of hnRNPK or GSK3β knockdown in RAW264.7 cells 24 hours after siRNA transfection. The numbers under each protein band indicate the fold changes after normalization using GAPDH and in comparison with the control group. (b) hnRNPK or GSK3β was knocked down using lentiviral-mediated shRNA in primary BMM. Western blotting with cell lysates was performed 48 hours after viral infection. The results shown are representative of at least 3 experiments. Quantification of TRAP-positive cells with (c) RAW264.7 cells, or (d) BMM performed 72 hours after RANKL induction to assess the degree of differentiation. Cells were photographed under microscope. TRAP-positive cells in 5 randomly chosen fields were counted. **/##P < 0.01. The results presented were the means ± SD of three independent experiments. (e) Western blotting showing the effect of hnRNPK knockdown in the cells used in (f,g). (f,g) RAW264.7 cells were transfected by hnRNPK siRNA, then induced with 100 ng/mL RANKL. At the time points of 0 (“-”, before induction), 12 and 72 hours, total RNA were extracted, reverse-transcribed into cDNA, and the indicated specific mRNA were quantified by real-time PCR using appropriate primers. ***P < 0.001. **P < 0.01. The results presented were the means ± SD of three independent experiments. The number under each protein band indicate the fold changes after normalization using GAPDH and in comparison with the control group. (h) hnRNPK or GSK3β was knocked down using lentiviral-mediated shRNA in primary BMM. In vitro bone-resorption assays were then performed as described. The scanning electron micrographs shown are representative of the bone slices for the indicated experimental groups. Cells infected by lentiviruses bearing non-target control shRNA were used as control. Scale bars represent 1 mm for the upper panels and 200 μm for the lower panels. (i) Quantification of the resorption pits. Resorption pits on each bone slice were counted. Pit areas were recognized and calculated with the help of Adobe Photoshop CS5. The sum of the pit number (left) and the pit area (right) on a bone slice are shown. The results presented are the means ± SD of three independent experiments. **/##P < 0.01.

