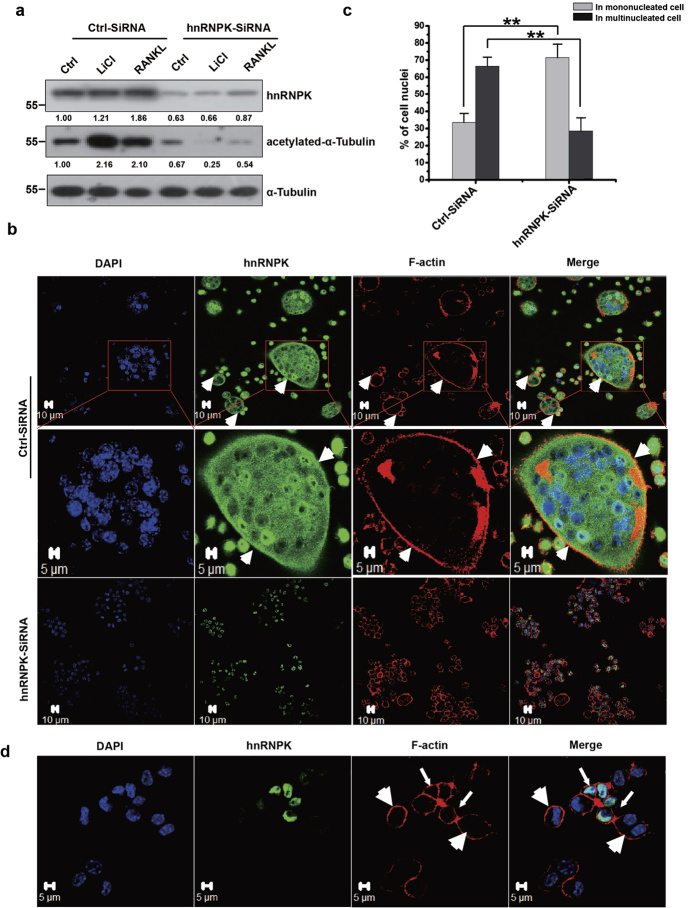
Figure 7. hnRNPK is required for the acetylation of tubulin and the formation of mature multinucleated osteoclast.
(a) The effect of hnRNPK knockdown on the tubulin acetylation. RAW264.7 cells were transfected by hnRNPK or control siRNA, and 24 hours later, stimulated by 100 ng/mL RANKL or 10 mM LiCl for 12 hours. Western blotting was then performed using the indicated antibodies. The numbers under each protein band indicate the fold changes after normalization using α-tubulin and in comparison with the control group. Gels were run under the same experimental conditions. For better clarity and conciseness of the presentation, cropped blots are shown. The raw uncropped images can be found in the Supplementary Figure 1. The cropping lines are indicated by black lines both in cropped and uncropped images. The result shown is representative of three independent experiments. (b) The effect of hnRNPK knockdown on the formation of the multi-nucleated osteoclasts. RAW264.7 cells were transfected by hnRNPK siRNA or control siRNA, and 24 hours later, stimulated by 100 ng/mL RANKL for 72 hours. Confocal immunofluorescence was performed as indicated. hnRNPK is stained in green, F-actin is stained in red with phalloidin, and nuclei are stained in blue with DAPI. Arrow heads indicate the co-localization of hnRNPK and F-actin in the periphery of the cell. Scale bars = 5 μM/10μM as indicated. The result shown is representative of three independent experiments. (c) Quantification of the cell nuclei in the mono- or multi-nucleated cells (>=3 nuclei) described in (b). The results presented are the mean values obtained from 5 randomly chosen fields. ***P < 0.01. (d) hnRNPK knockdown has no effect on the actin belt formation. RAW264.7 cells were transfected by hnRNPK siRNA, and 24 hours later, stimulated by 100 ng/mL RANKL for 24 hours. Confocal immunofluorescence experiment was then performed to visualize the actin belt formation and the effect of hnRNPK knockdown by siRNA. Cells in which hnRNPK has been successfully depleted are indicated by the big arrow heads whereas those still express hnRNPK are indicated by the small arrows. Scale bars = 5 μM. The result shown is representative of three independent experiments.

