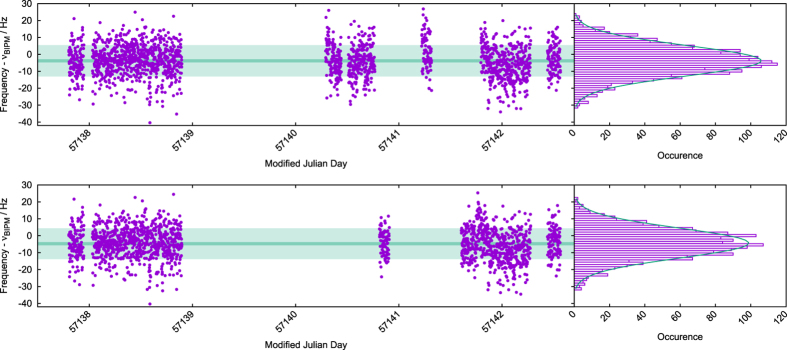
Figure 8. Frequencies of the 1S0 – 3P0 clock transition in bosonic 88Sr recorded in Sr1 and Sr2 at the indicated MJD (top and bottom panels, respectively).
In the left panels each solid circle represent 100 s of averaged data, the light and dark-green regions represent 1 σ standard deviation and standard deviation of the mean, respectively. The offset frequency  is the BIPM recommended frequency value10. The right panels show a histogram of the frequency measurements with fitted Gaussian function.

