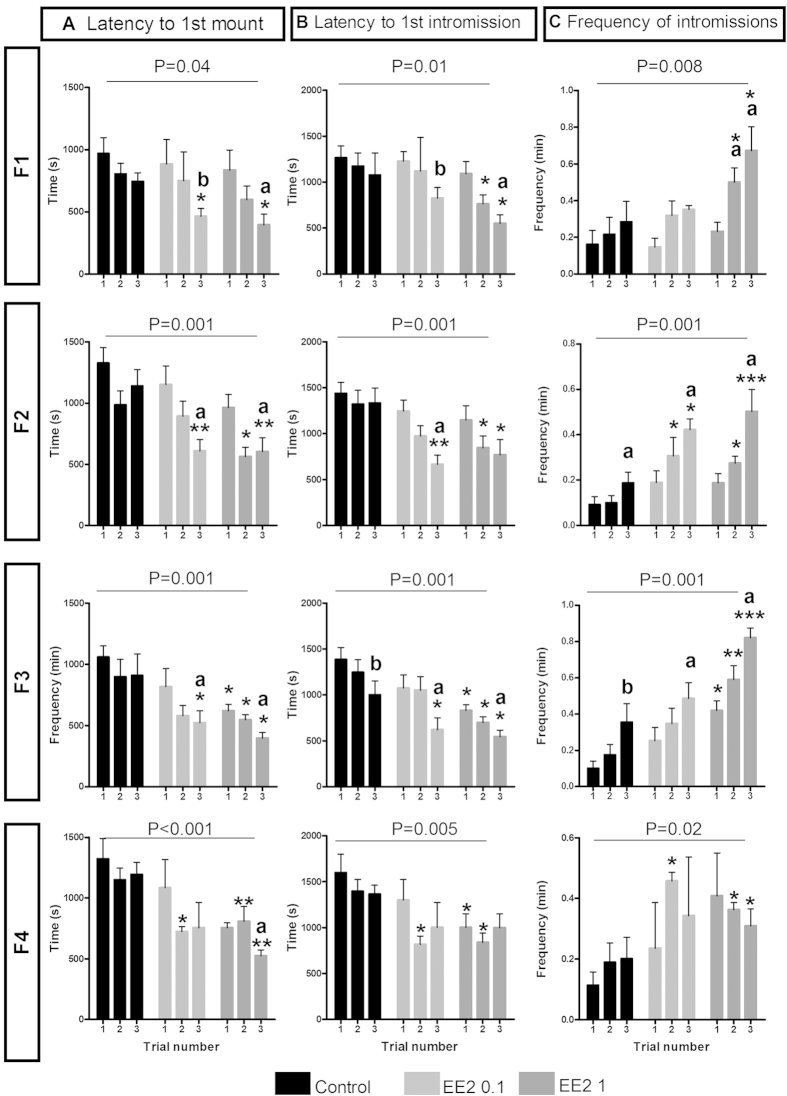
Figure 1. Developmental EE2 exposure affected male sexual behavior of adult F1 mice and their F2 to F4 progenies.
Latencies per second to the first mount (A) and first intromission (B) and frequency of intromissions per minute (C) for each experimental group (Control, EE2 0.1 and EE2 1) (n = 3–5 litters for each group of each generation). Data are expressed as means ± SEM. *p-value < 0.05, **p-value < 0.01 and ***p-value < 0.001; EE2 0.1 or EE2 1 group versus Control group of the same trial test by Bonferroni post-hoc tests after two-way ANOVA. a: p-value < 0.05, aa: p-value < 0.01, aaa: p-value < 0.001, b: p-value = 0.07; significantly different from trial 1 using Friedman tests within each experimental group.

