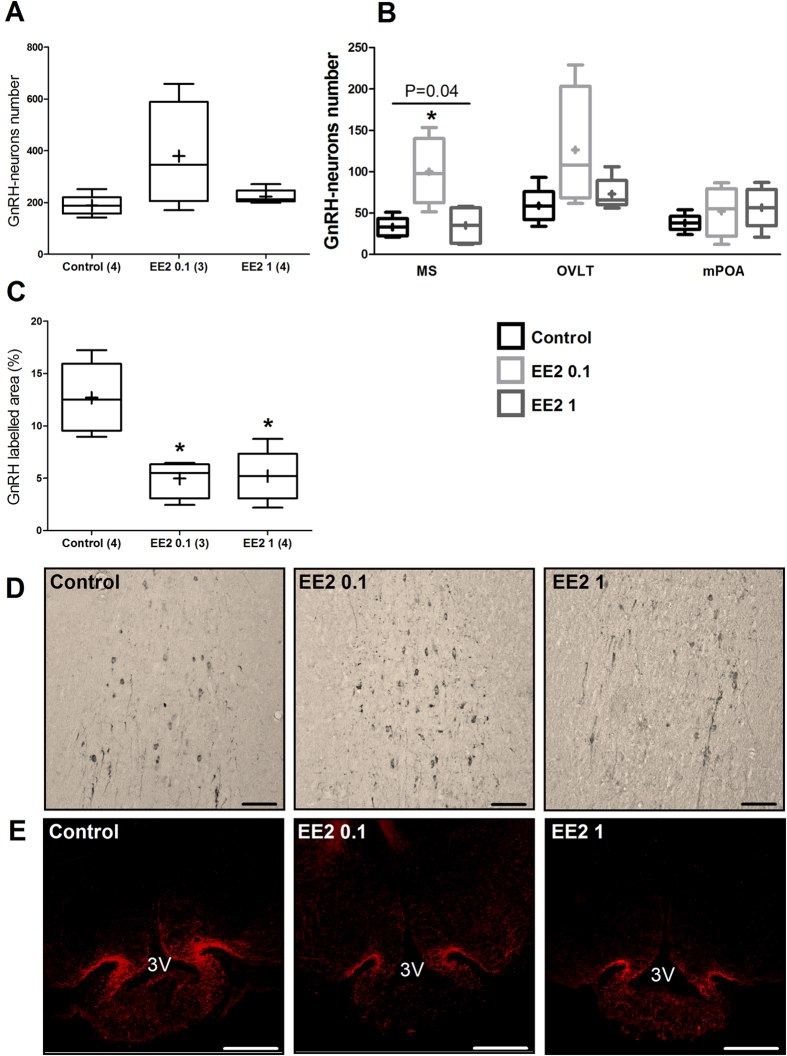
Figure 3. Developmental EE2 exposure disturbed GnRH neuron neuroanatomy in adult F1 male mice.
(A) Tukey’s boxplots of total numbers of GnRH immunoreactive neurons in the hypothalamic POA for each experimental group. (B) Numbers and distribution of GnRH immunoreactive neurons according to the three neuroanatomical areas where cell bodies were counted: Median Septum (MS), Organum Vasculosum Laminae Terminalis (OVLT) and medial PreOptic Area (mPOA). (C) Box-plots of the mean GnRH labeled surface in three areas of the median eminence (ME; anterior, middle and posterior). The line in the middle of the box is plotted at the median and (+) is the mean. Numbers in brackets represent litter numbers. Kruskal-Wallis test with Dunn’s post-test with *p-value < 0.05. (D,E) Representative photographs of immunohistochemical labeling with DAD-Ni staining of GnRH neurons in the MS (D) and immunofluorescent terminal nerves in the ME (E) of Control, EE2 0.1 and EE2 1 males. Scale bars = 100 μm.

