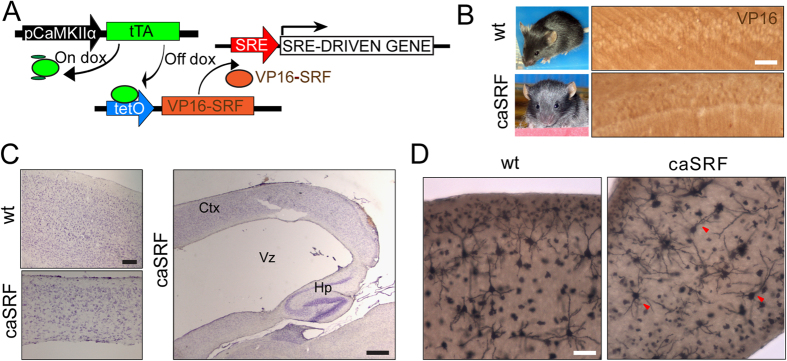
Figure 4. caSRF transgenic mice show severe neurological defects.
(A) Scheme of the double transgenic approach. (B) Images of control and bitransgenic mice (left) and immunostaining of the CA1 subfield using α-VP16 antibody (right). Scale bar: 20 μm (C) Nissl staining of wt and caSRF animals. Left panels: Gross abnormalities of cortical somas in caSRF mice. Scale bar: 100 μm. Right panels: Hydrocephalia in caSRF animals. Ctx: cortex, Vz: ventricle, Hp: hippocampus. Scale bar: 500 μm. (D) Golgi staining showing the abnormal orientation of apical dendrites in principal cortical neurons (red arrowheads) of caSRF bitransgenics. Scale bar: 100 μm.

