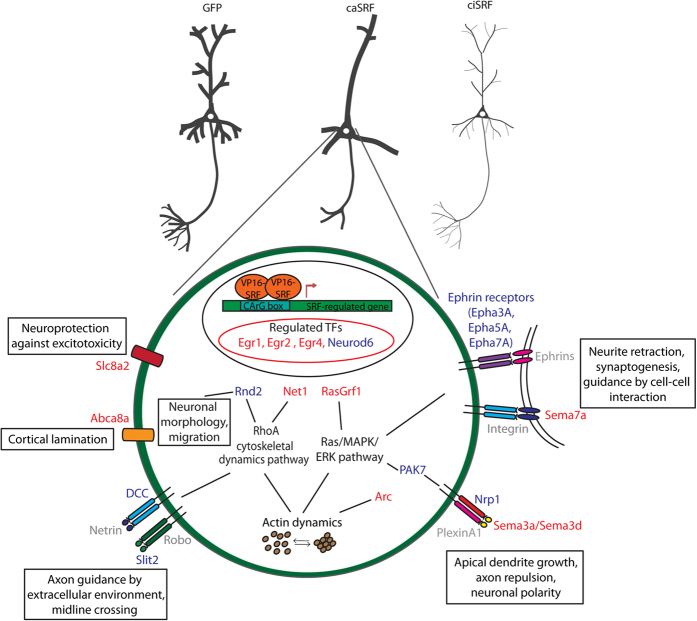
Figure 7. SRF target genes and biological processes affected by caSRF.
Scheme highlighting SRF target genes and biological processes. Putative effector proteins upregulated or downregulated upon caSRF expression are shown in red or blue, respectively. Non affected proteins in our transcriptomics analysis are shown in grey.

