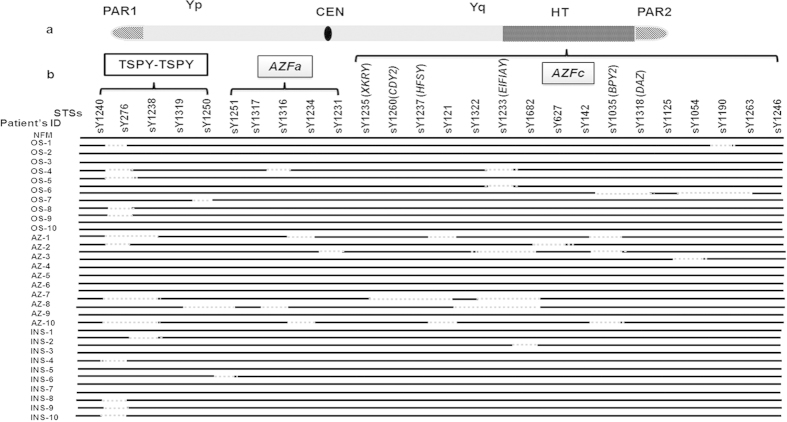
Figure 1. Diagrammatic illustration showing analysis of the MSY region in the patients’ samples.
(a) Represents human Y chromosome. HT indicates the heterochromatin region of Y chromosome; CEN, centromere and PAR, psuedoautosomal regions. (b) Regions on the Y chromosome where STS were analyzed. Sample IDs are given on the left. NFM represent normal fertile males; OS, oligospermic; AZ, Azoospermic and INS, Infertile males with normal spermiogram. Black solid lines for relates to the samples indicating the presence of the STS analyzed, whereas the dotted lines represent deletion of the same.

