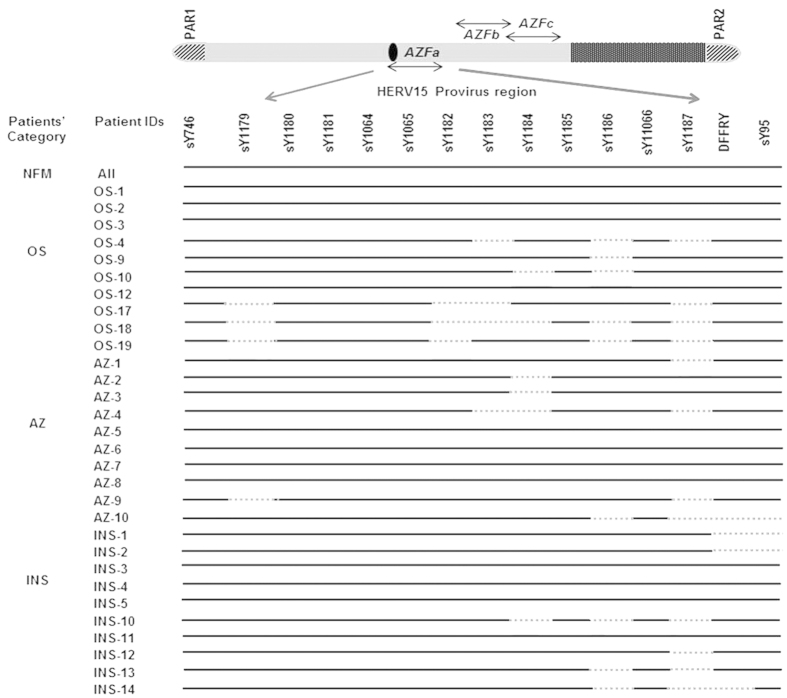
Figure 2. STS mapping of AZFa region of the patients.
STS mapping of AZFa region was done using samples from infertile males of different categories (oligospermic OS, azoospermic AZ, infertile males with normal spermiogram INS) and normal fertile males (NFM). Presence of the corresponding STSs in the patients is indicated by solid lines and absence by dotted lines; patient IDs and their categories are shown on the left. As expected, all the STSs were found to be intact in the fertile male samples used as control.

