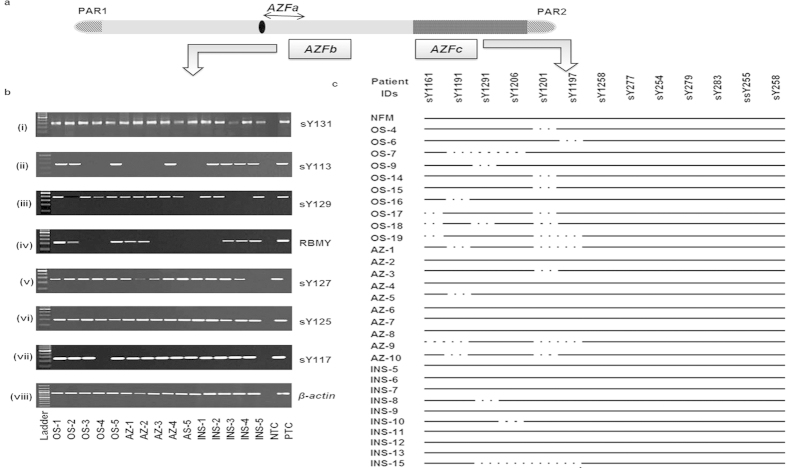
Figure 3. STS mapping of AZFb and AZFc regions.
(a) Diagrammatic illustration of human Y chromosome. (b) Representative gels (i-viii) showing STS mapping of AZFb region for some patients. β-actin was used as an internal control. The STSs analyzed are shown on the right side and the patients IDs, in the bottom. NTC and PTC indicate the negative and positive controls, respectively. NFM, OS, AZ and INS indicate normal fertile males, oligospermic, azoospermic and infertile males with normal spermiogram, respectively. (c) AZFc STS mapping results of some of the representative samples from each category of males. Presence of the corresponding STSs (given on the top) in the patients are indicated by solid line and absence by dotted ones. The patient IDs are shown on the left side.

