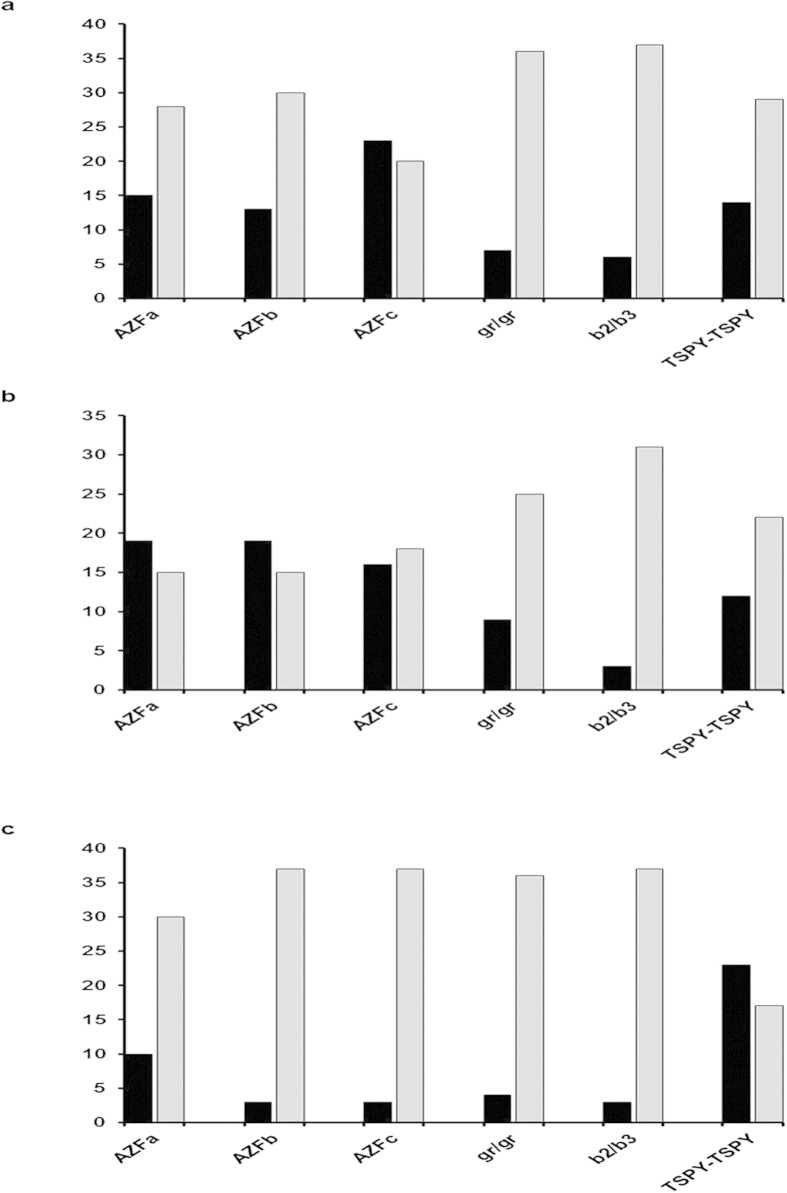
Figure 4. Deletion frequency in the AZF regions in the infertile males from different categories.
X-axis depicts the deletions in different regions of the Y chromosome, whereas the Y-axis shows % of the patients. Black bars indicate the % of males (belonging to particular category) with deletions and grey bars correspond to % of males without deletions. Panels a, b and c are for the OS, AZ and INS respectively. No deletions were observed in the normal fertile males.

